When the temperature recordings were moved to the "weather station" in the backyard, there were rainfall recordings made. Snow and ice freezes in the measurement device and does not get recorded very well, so the colder months will have more precipitation than shown. What is shown here is thus rain, not snow.
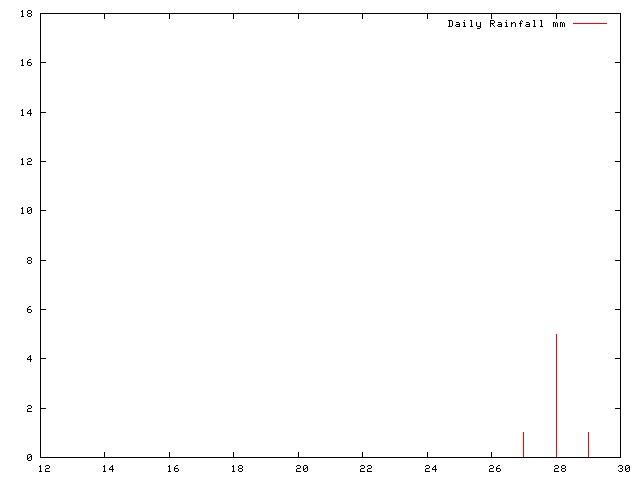
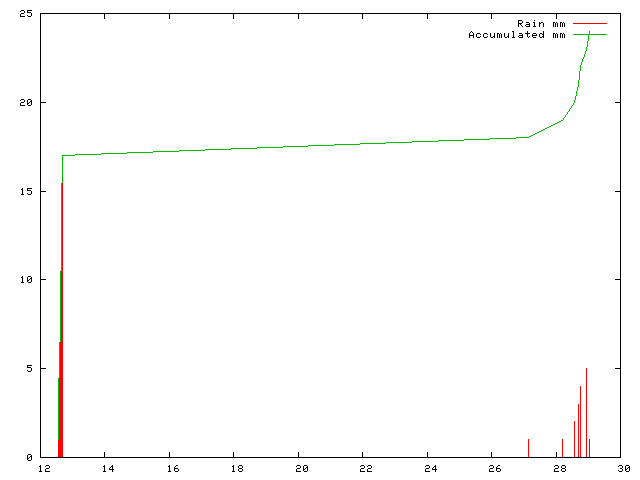
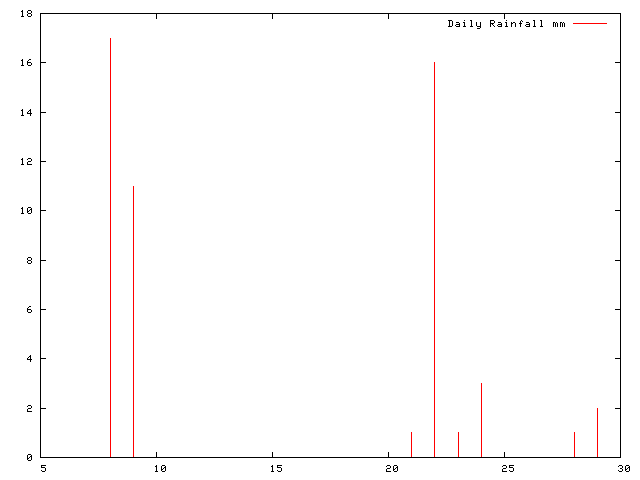
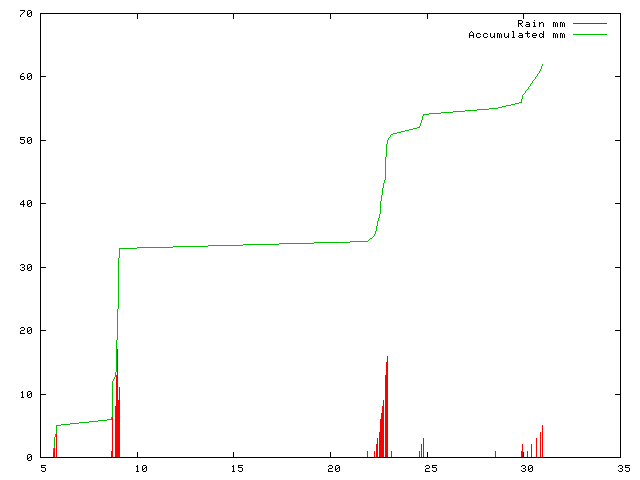
On all these plots, the Y axis is rainfall in mm and the X axis is the day of the month.
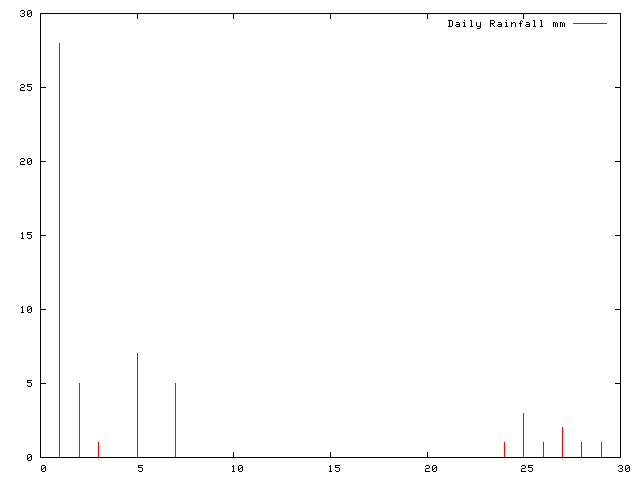
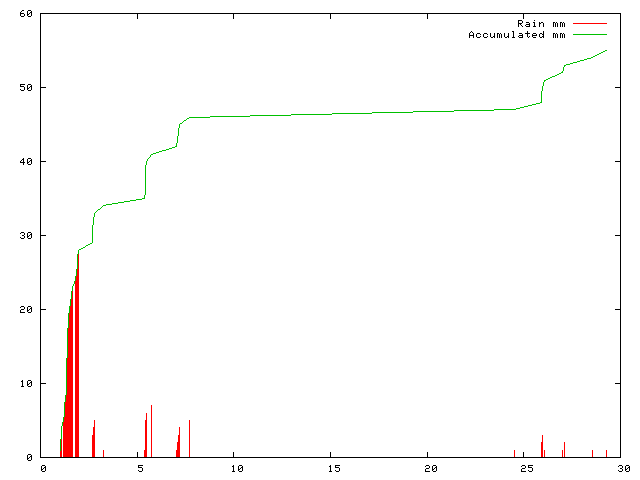
Rainfall plots for October 2007
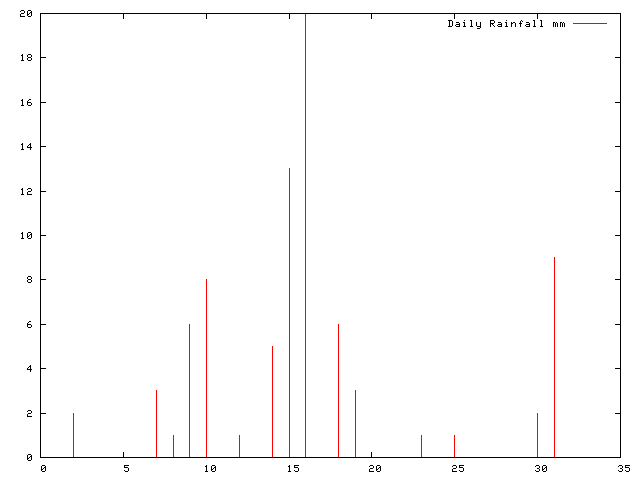
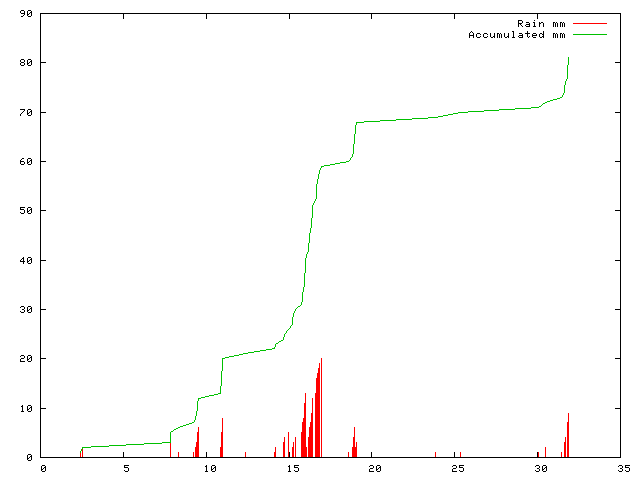
Rainfall plots for November 2007
Rainfall plots for December 2007
Rainfall plots for January 2008
Temperature Plots
| 2001-2002 | 2003 | 2004 | 2005 | 2006 | 2007 | 2008 | 2009 | |||||||||
| 2010 | 2011 | 2012 | 2013 | 2014 | 2015 | 2016 | 2017 | 2018 | 2019 | 2020 | 2021 | 2022 | 2023 | 2024 | 2025 | 2026 |
Air Pressure Plots
| 2013 | 2014 | 2015 | 2016 | 2017 | 2018 | 2019 |
| 2020 | 2021 | 2022 | 2023 | 2024 | 2025 | 2026 |
Rainfall Plots
| 2007 | 2008 | 2009 | ||||||||||||||
| 2010 | 2011 | 2012 | 2013 | 2014 | 2015 | 2016 | 2017 | 2018 | 2019 | 2020 | 2021 | 2022 | 2023 | 2024 | 2025 | 2026 |