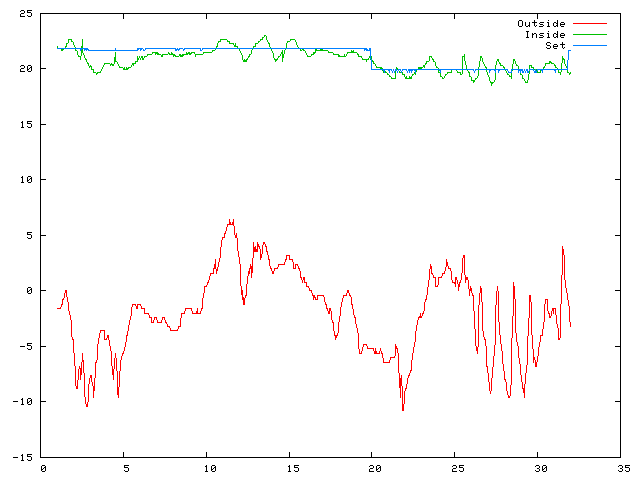
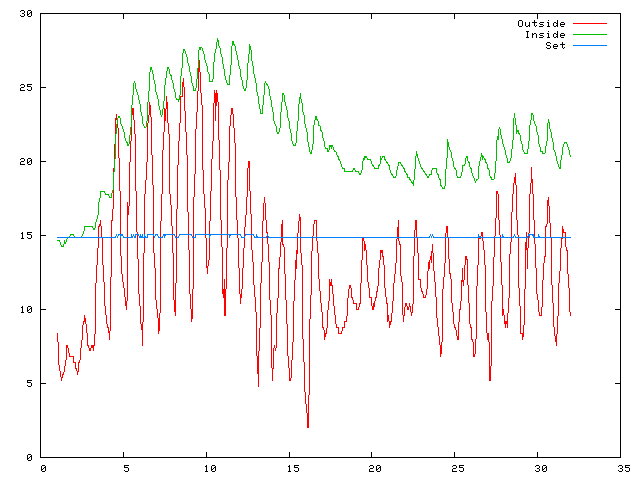
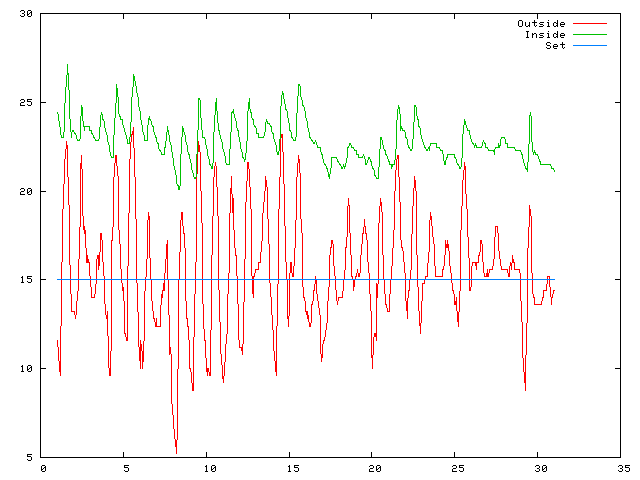
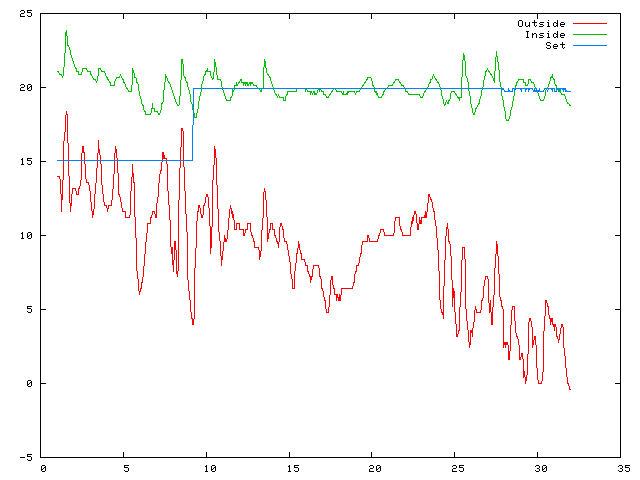
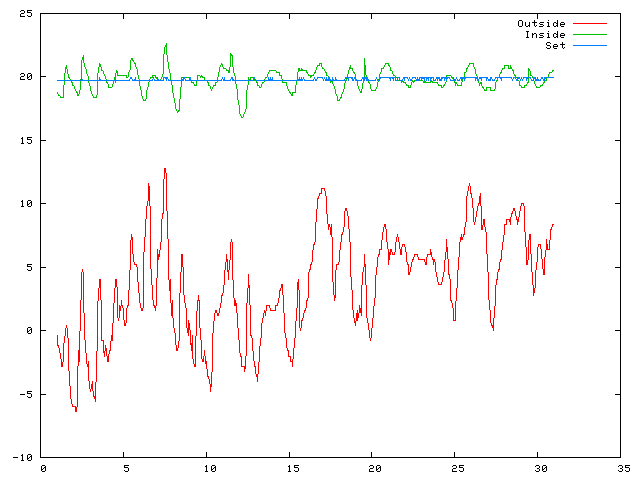
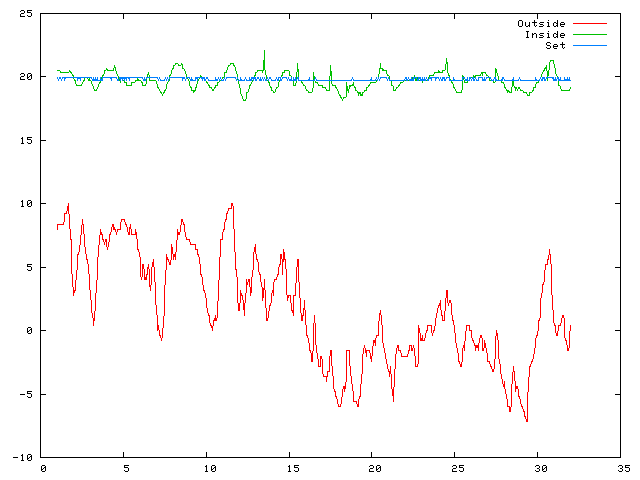
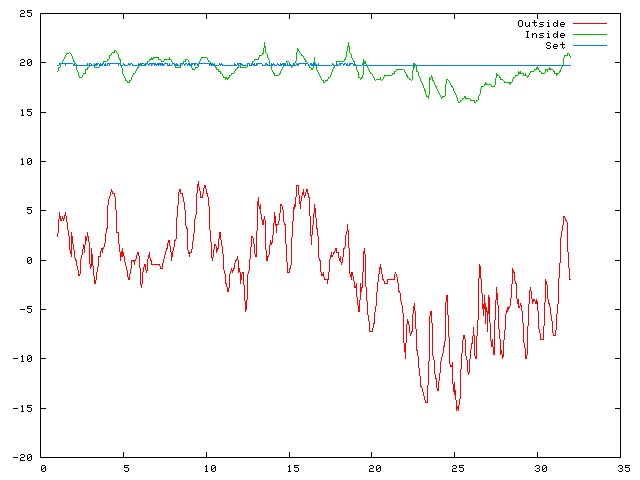
On all these plots, the Y axis is temperature in degrees C and the X axis is the day of the month. There are placeholders for the later months, data will become available as time goes on.
Temperature plot for January 2006
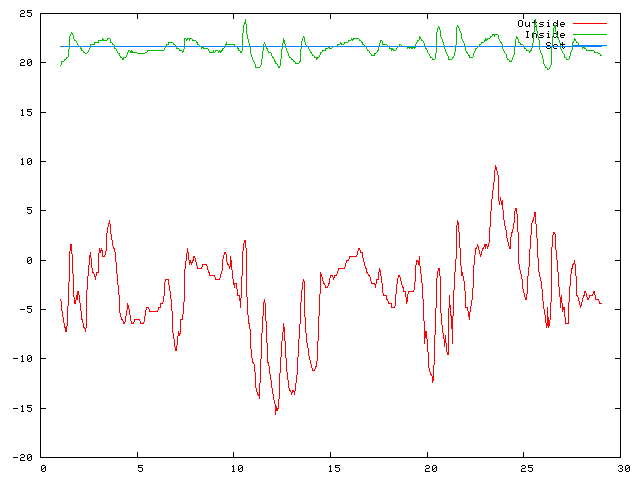
Temperature plot for February 2006
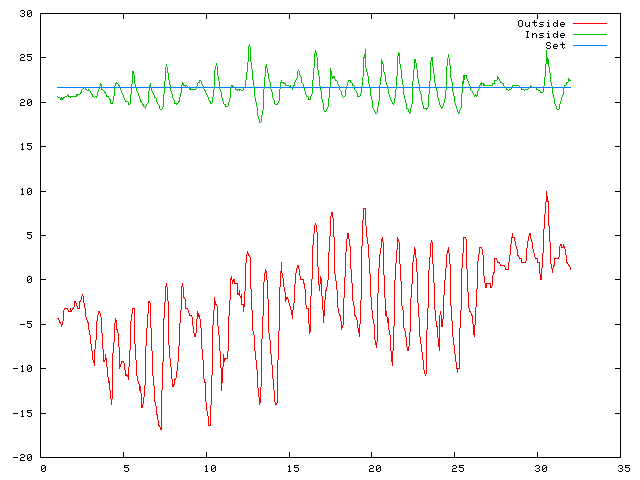
Temperature plot for March 2006
Temperature plot for April 2006
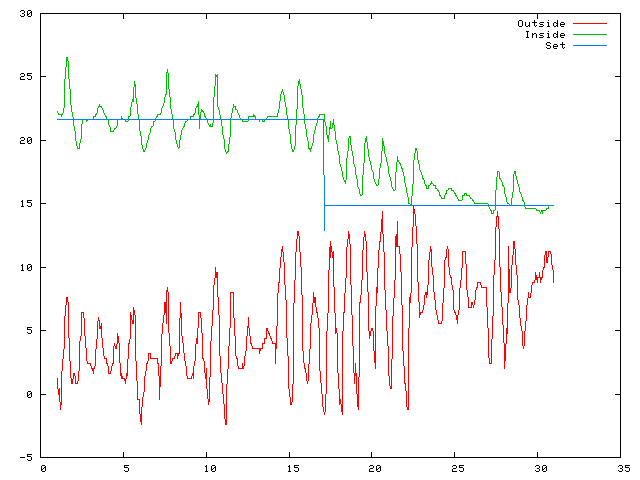
Temperature plot for May 2006
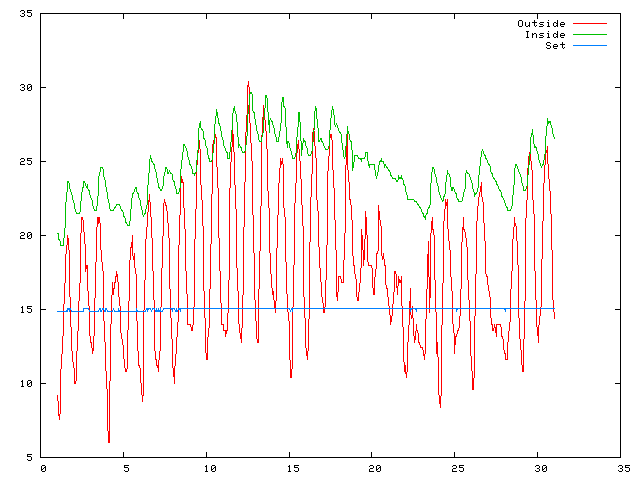
Temperature plot for June 2006
Temperature plot for July 2006
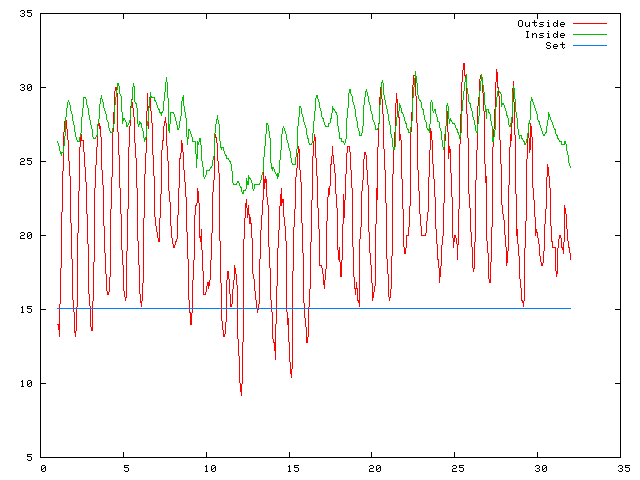
There was a "tropical night" with the minimum temperature of 20 degrees on July 22-23.
Temperature plot for August 2006
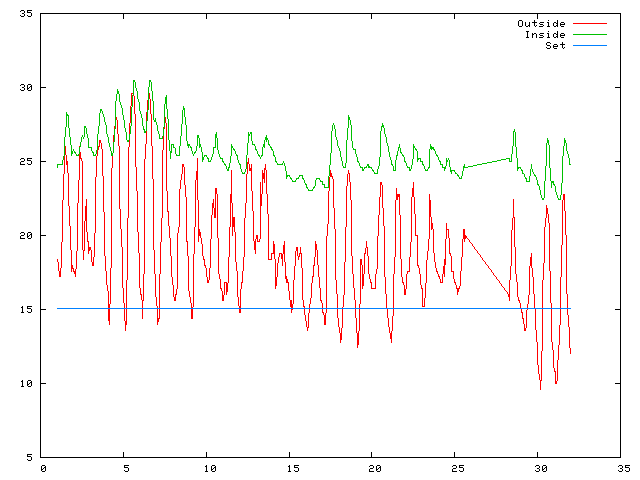
There was a machine failure, during the afternoon of August 25 so data between 251536 (9343) and 280533 (9405) was lost.
Temperature plot for September 2006
Temperature plot for October 2006
Temperature plot for November 2006
Temperature plot for December 2006
Temperature plot for January 2007
Temperature Plots
| 2001-2002 | 2003 | 2004 | 2005 | 2006 | 2007 | 2008 | 2009 | ||
| 2010 | 2011 | 2012 | 2013 | 2014 | 2015 | 2016 | 2017 | 2018 | 2019 |
| 2020 | 2021 | 2022 | 2023 | 2024 | 2025 | 2026 |
Air Pressure Plots
| 2013 | 2014 | 2015 | 2016 | 2017 | 2018 | 2019 |
| 2020 | 2021 | 2022 | 2023 | 2024 | 2025 | 2026 |
Rainfall Plots
| 2007 | 2008 | 2009 | |||||||
| 2010 | 2011 | 2012 | 2013 | 2014 | 2015 | 2016 | 2017 | 2018 | 2019 |
| 2020 | 2021 | 2022 | 2023 | 2024 | 2025 | 2026 |