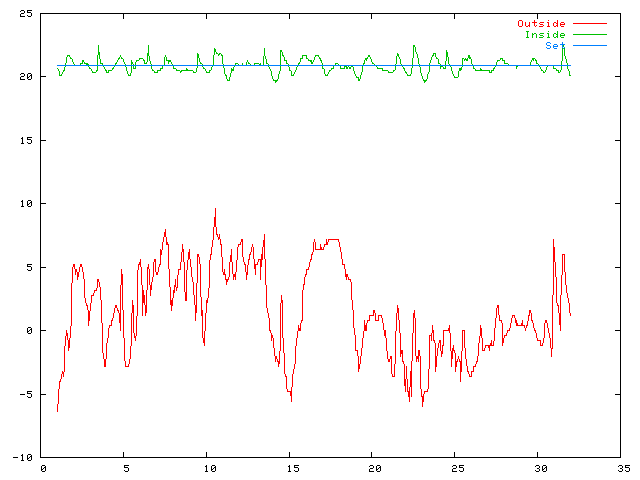
On all these plots, the Y axis is temperature in degrees C and the X axis is the day of the month.
Temperature plot for January 2004
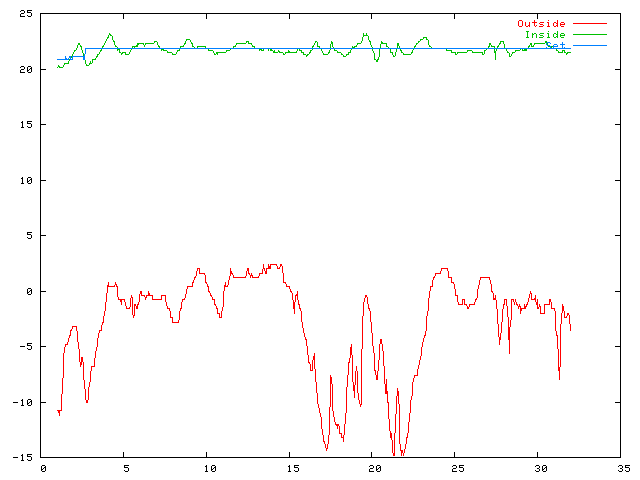
The coldest recorded in 2004 was on January 21, at 08.23 UTC, -14.8 degrees.
Temperature plot for February 2004
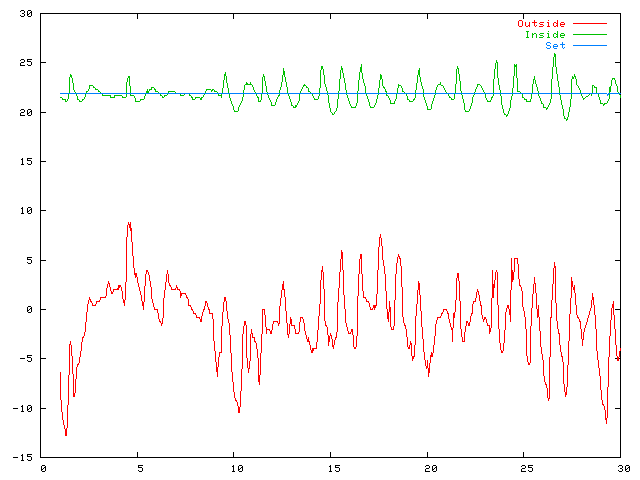
Temperature plot for March 2004
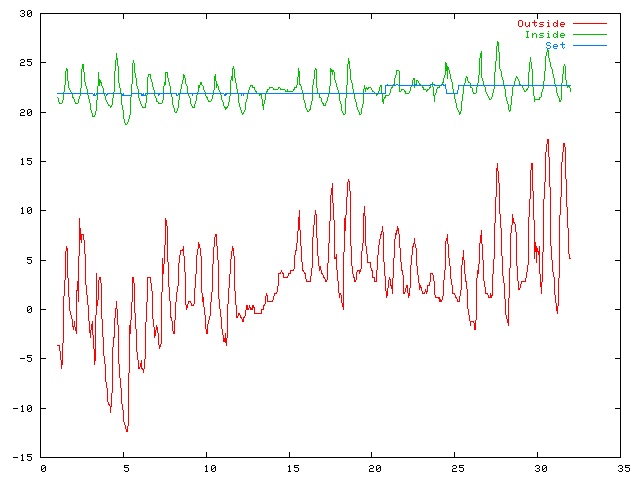
Temperature plot for April 2004
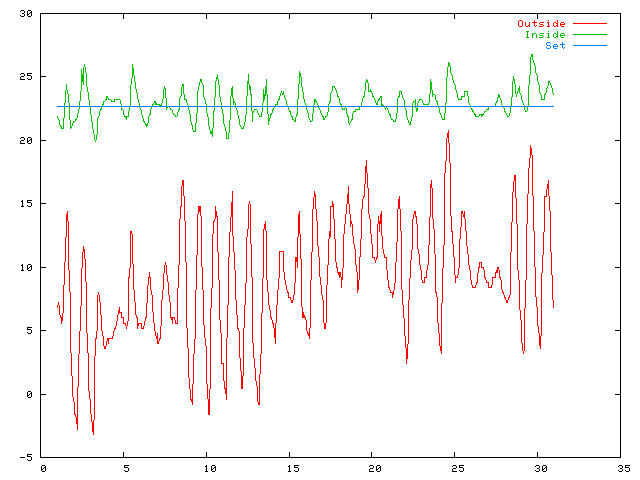
Heating was turned off on the 25th or thereabouts.
Temperature plot for May 2004
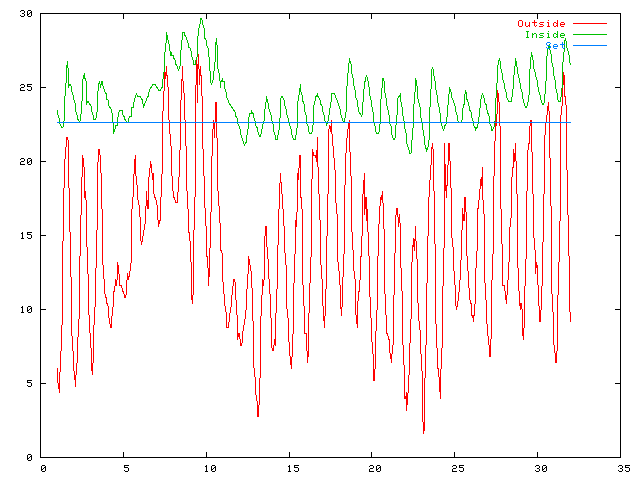
Temperature plot for June 2004
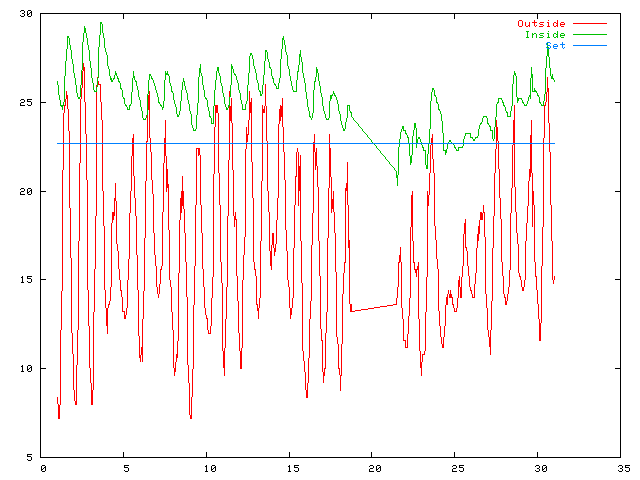
There was an outage from the afternoon of June 18 to midday June 21.
Temperature plot for July 2004
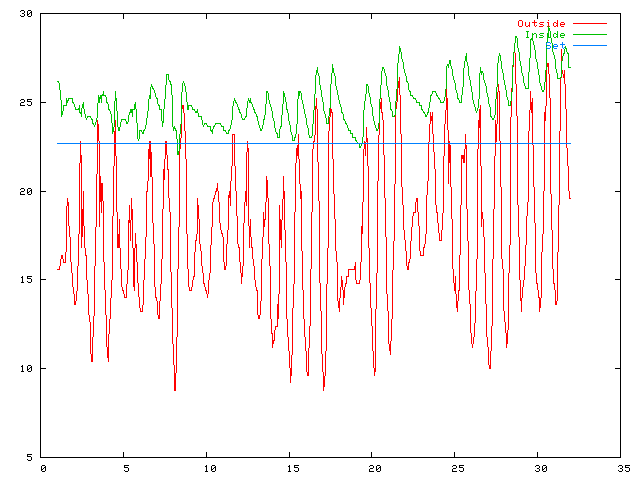
Temperature plot for August 2004
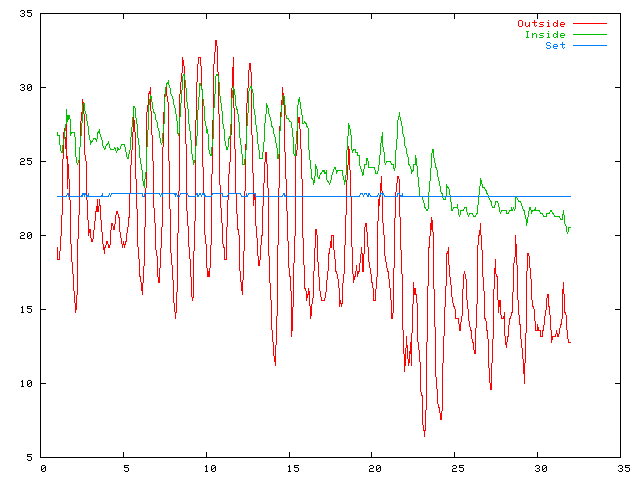
The years maximum day temperature recorded was on August 10 at 13.55 UTC, 33.2 degrees.
Temperature plot for September 2004
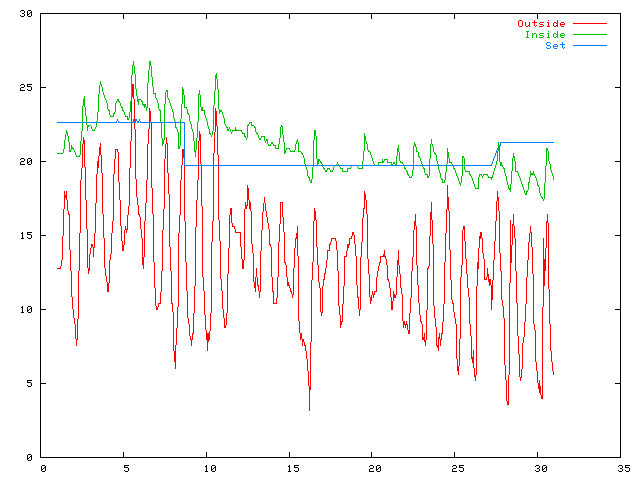
Temperature plot for October 2004
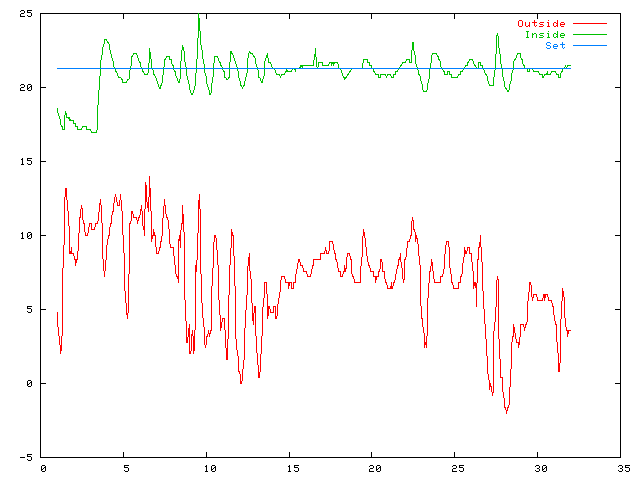
Heating was turned on on the 4th, again after it got down towards 16 degrees inside.
Temperature plot for November 2004
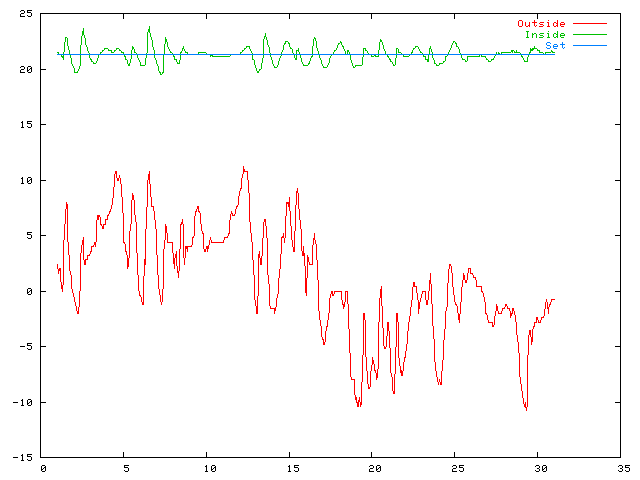
Temperature plot for December 2004
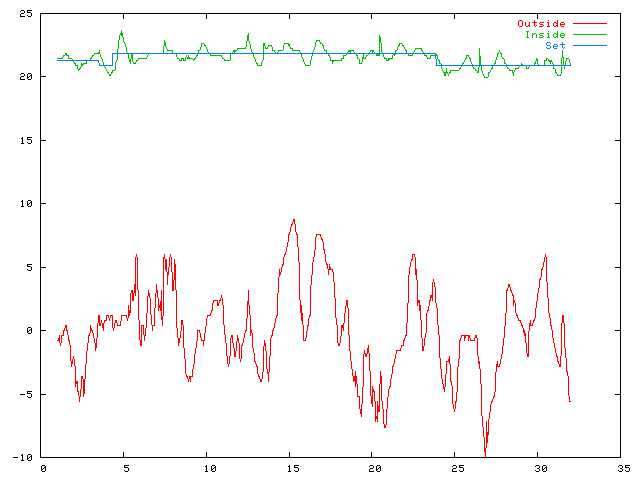
Temperature plot for January 2005
Temperature Plots
| 2001-2002 | 2003 | 2004 | 2005 | 2006 | 2007 | 2008 | 2009 | ||
| 2010 | 2011 | 2012 | 2013 | 2014 | 2015 | 2016 | 2017 | 2018 | 2019 |
| 2020 | 2021 | 2022 | 2023 | 2024 | 2025 | 2026 |
Air Pressure Plots
| 2013 | 2014 | 2015 | 2016 | 2017 | 2018 | 2019 |
| 2020 | 2021 | 2022 | 2023 | 2024 | 2025 | 2026 |
Rainfall Plots
| 2007 | 2008 | 2009 | |||||||
| 2010 | 2011 | 2012 | 2013 | 2014 | 2015 | 2016 | 2017 | 2018 | 2019 |
| 2020 | 2021 | 2022 | 2023 | 2024 | 2025 | 2026 |