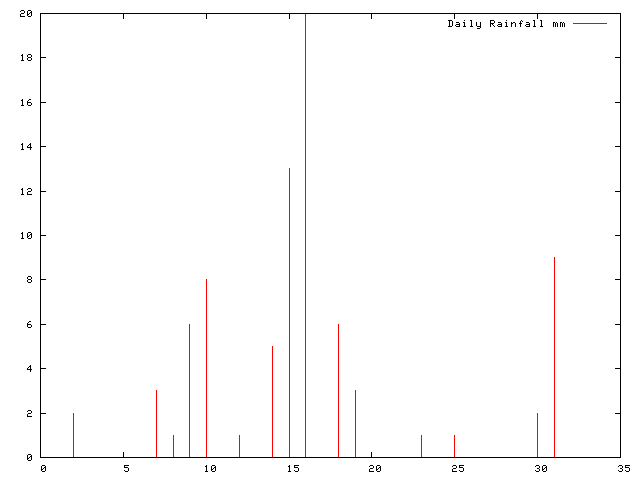
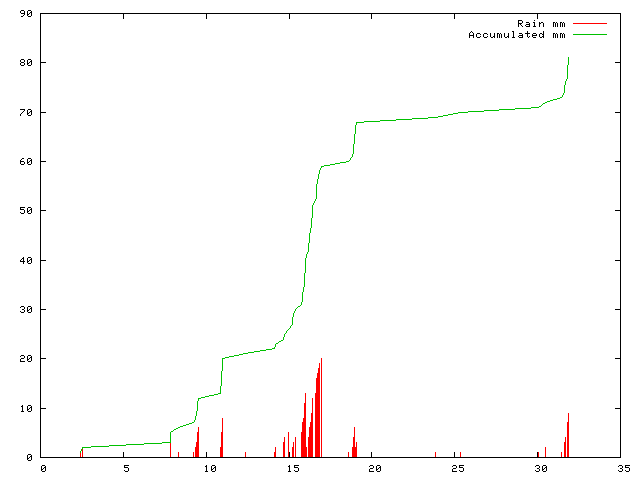
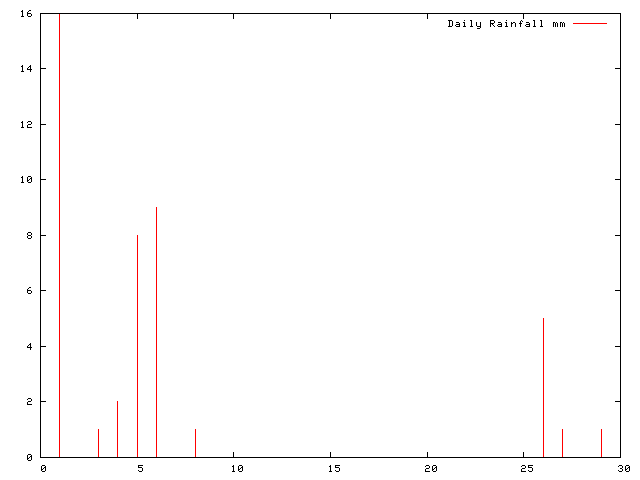
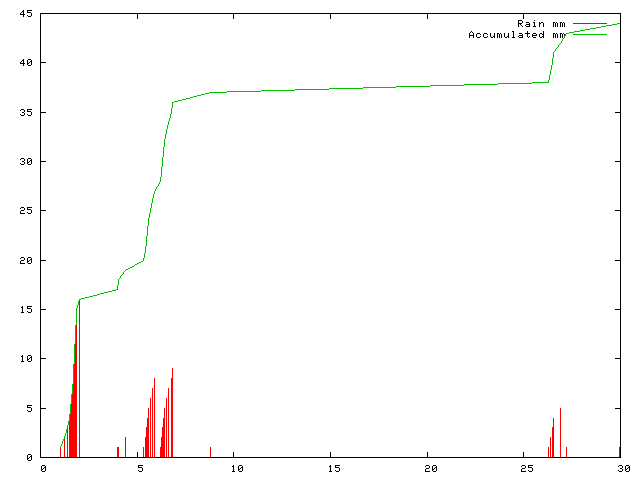
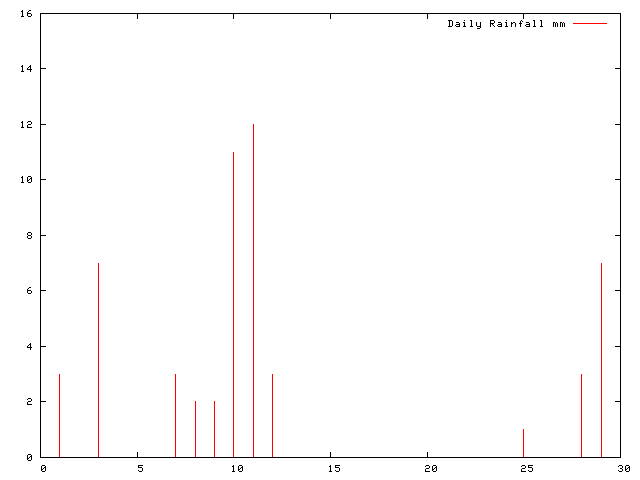
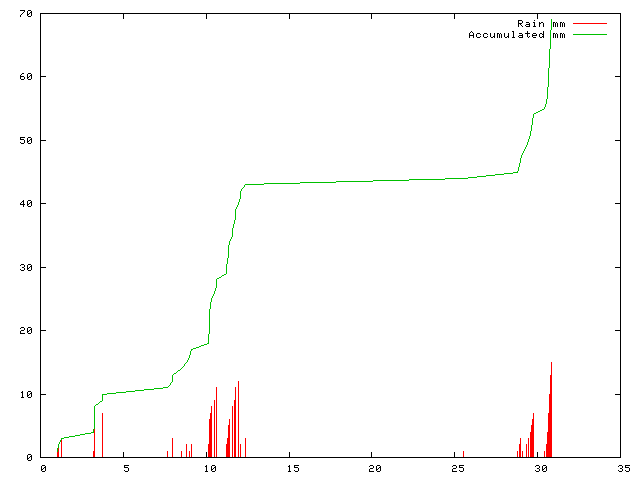
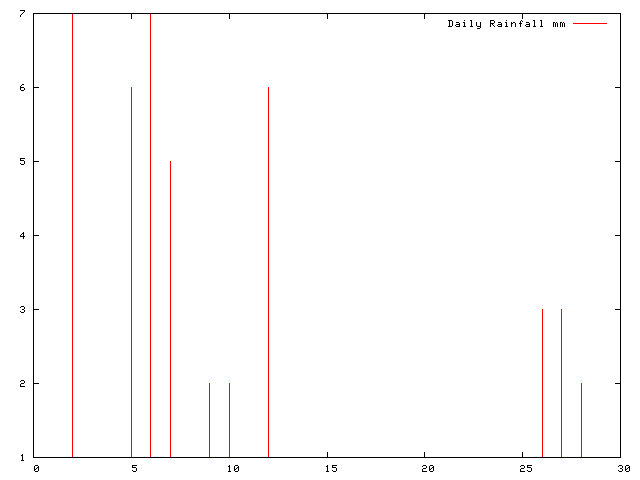
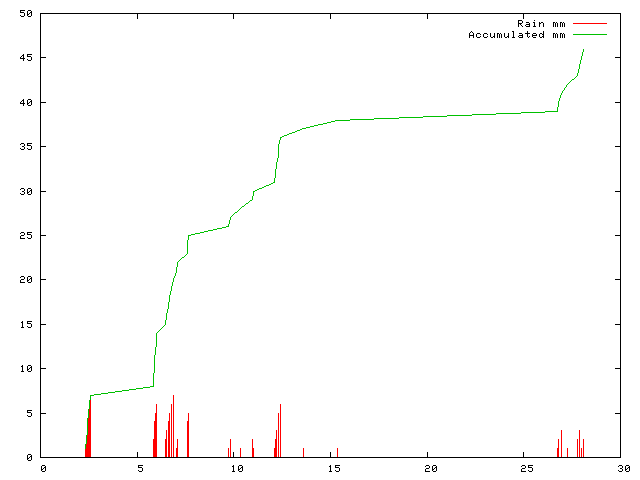
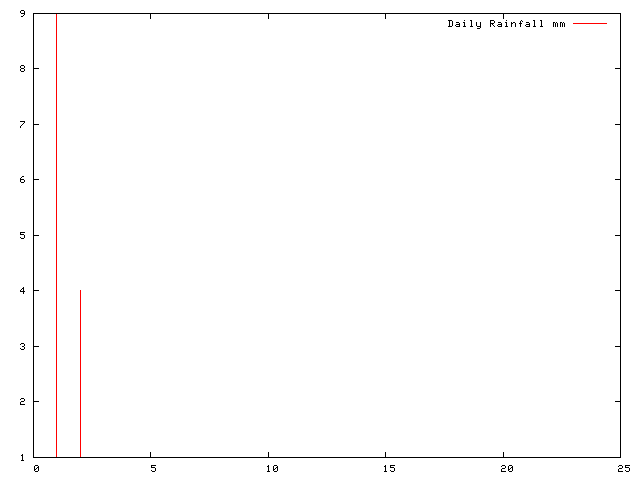
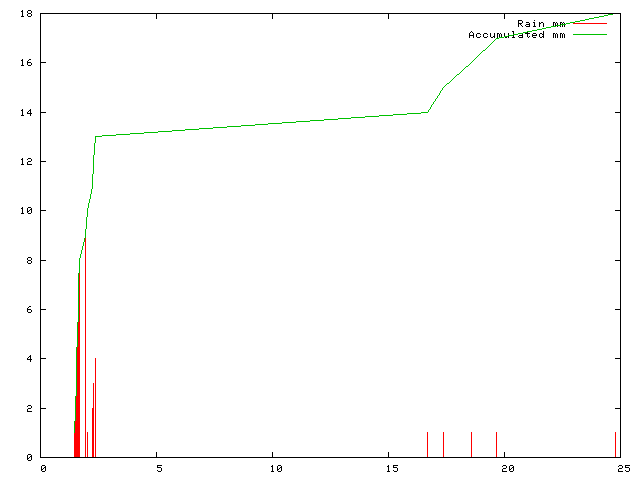
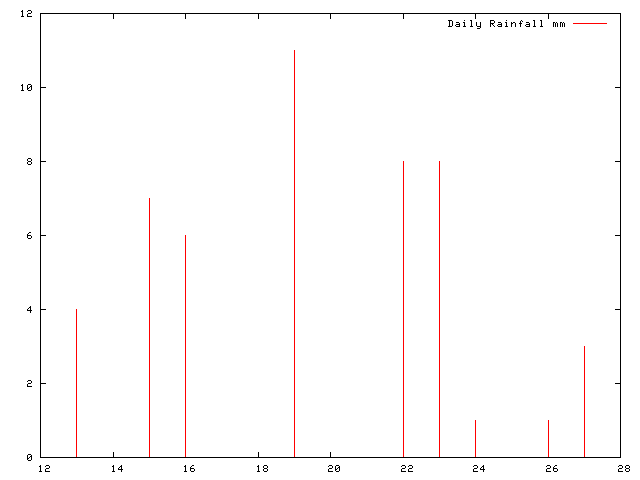
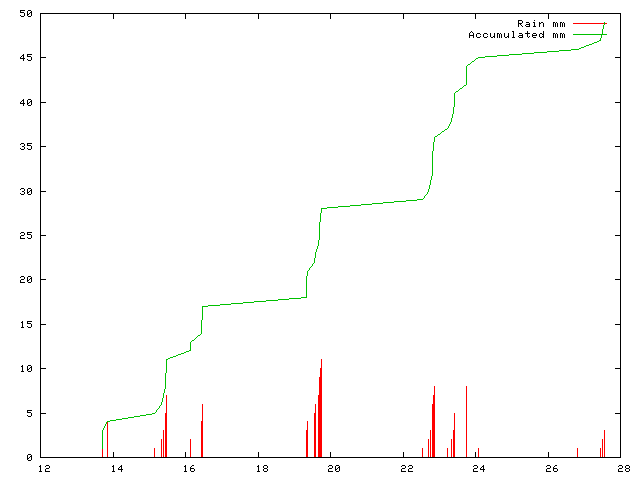
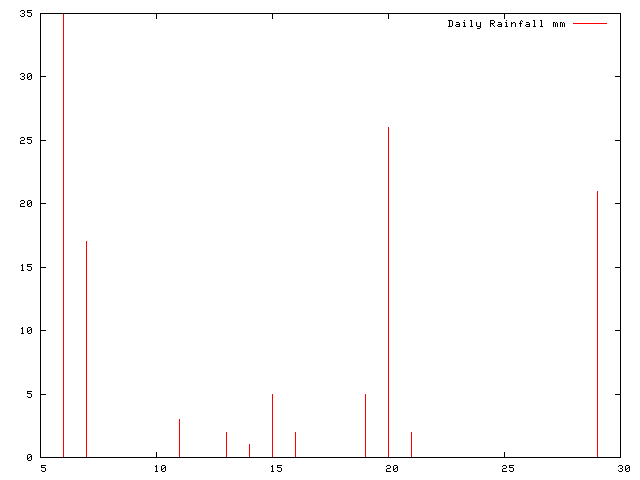
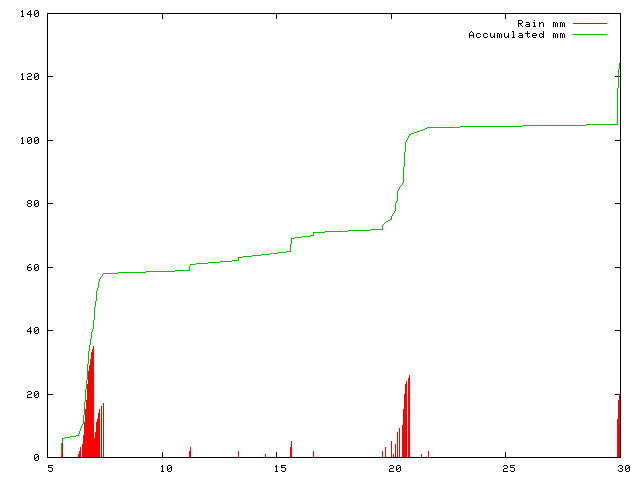
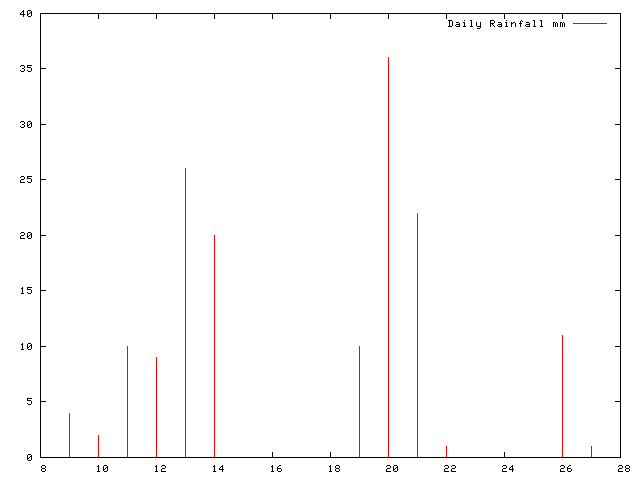
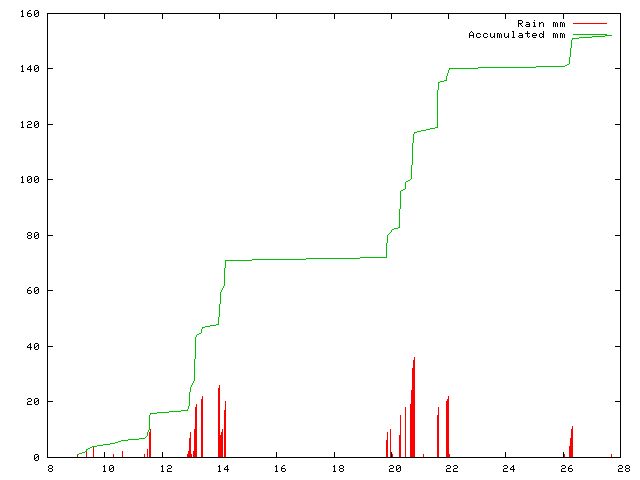
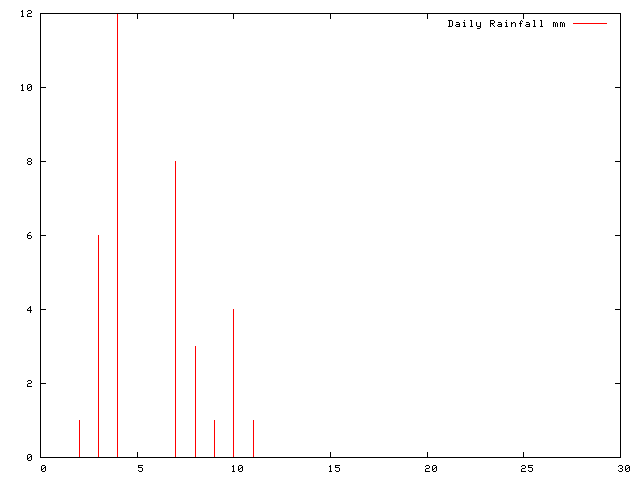
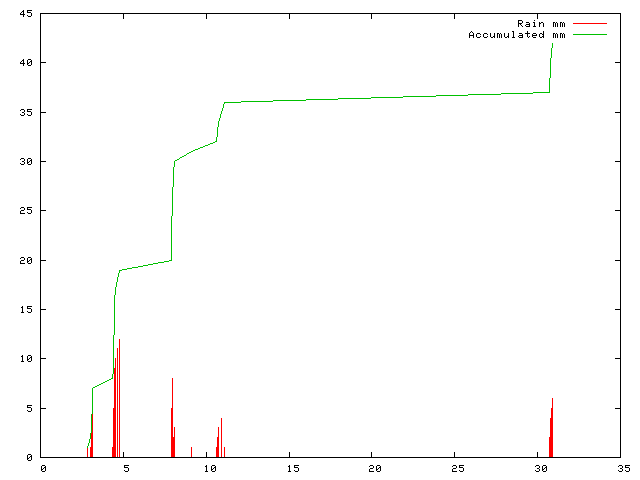
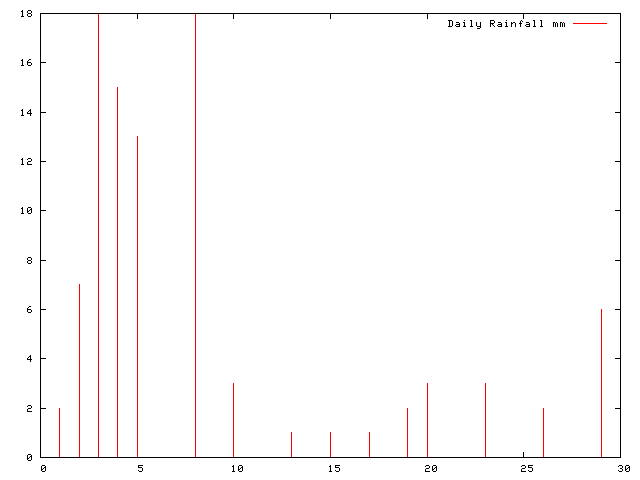
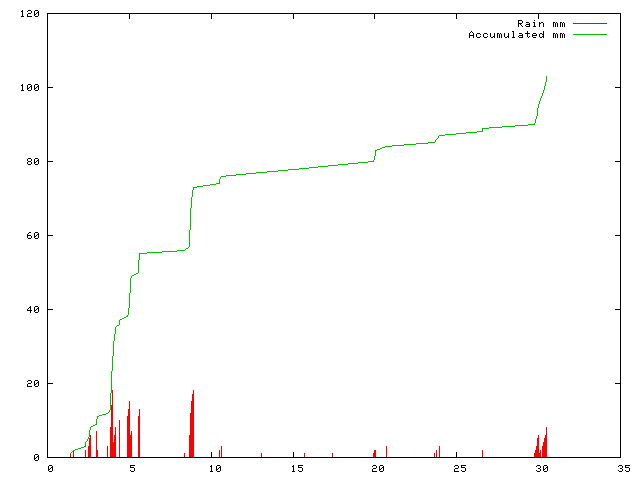
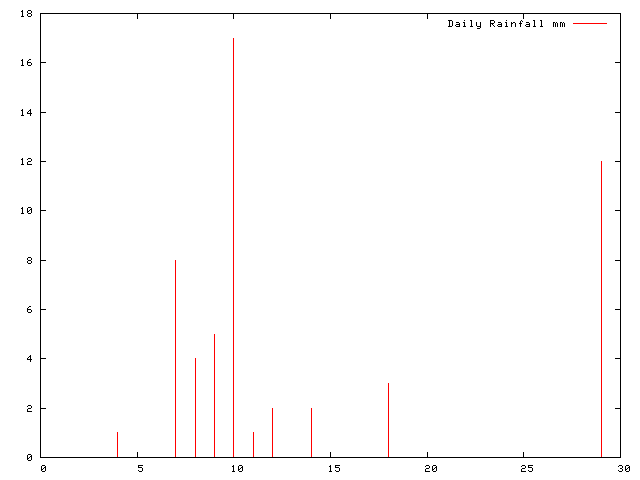
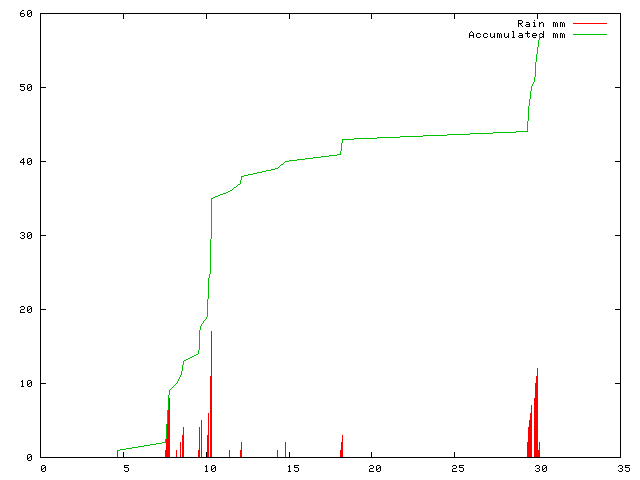
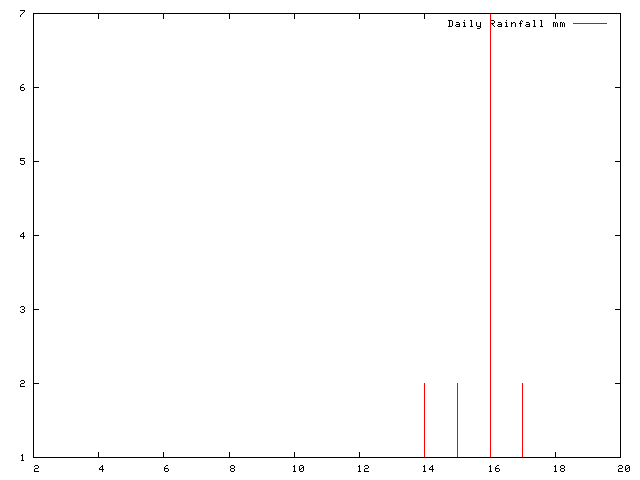
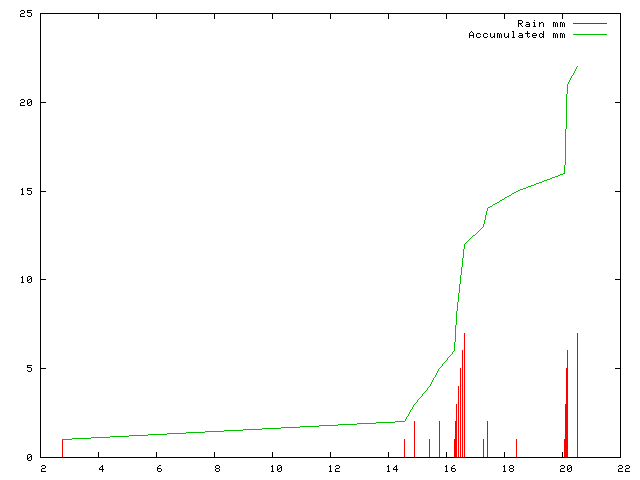
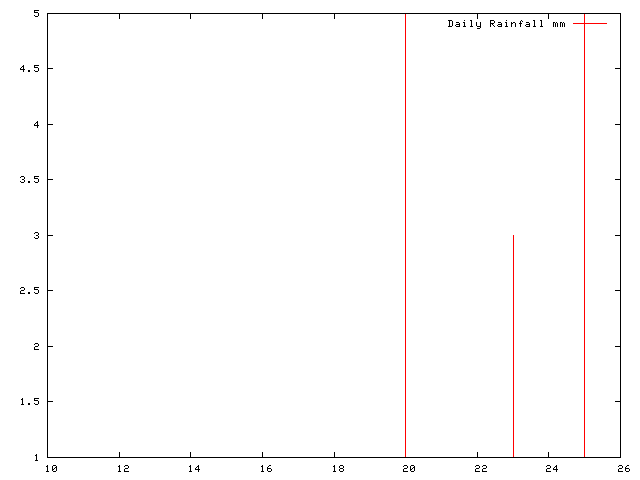
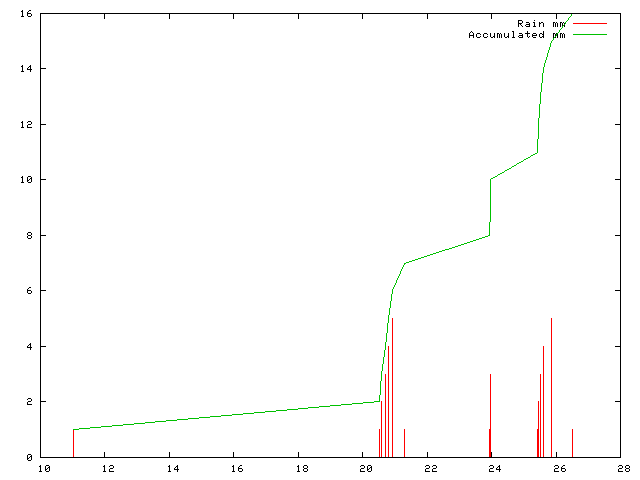
On all these plots, the Y axis is rainfall in millimeters and the X axis is the day of the month. There are placeholders for the later months, data will become available as time goes on.
Rainfall plots for January 2008
Rainfall plots for February 2008
Rainfall plots for March 2008
Rainfall plots for April 2008
Rainfall plots for May 2008
Rainfall plots for June 2008
Rainfall plots for July 2008
Rainfall plots for August 2008
Rainfall plots for September 2008
Rainfall plots for October 2008
Rainfall plots for November 2008
Rainfall plots for December 2008
Rainfall plots for January 2009
Temperature Plots
| 2001-2002 | 2003 | 2004 | 2005 | 2006 | 2007 | 2008 | 2009 | |||||||||
| 2010 | 2011 | 2012 | 2013 | 2014 | 2015 | 2016 | 2017 | 2018 | 2019 | 2020 | 2021 | 2022 | 2023 | 2024 | 2025 | 2026 |
Air Pressure Plots
| 2013 | 2014 | 2015 | 2016 | 2017 | 2018 | 2019 |
| 2020 | 2021 | 2022 | 2023 | 2024 | 2025 | 2026 |
Rainfall Plots
| 2007 | 2008 | 2009 | ||||||||||||||
| 2010 | 2011 | 2012 | 2013 | 2014 | 2015 | 2016 | 2017 | 2018 | 2019 | 2020 | 2021 | 2022 | 2023 | 2024 | 2025 | 2026 |