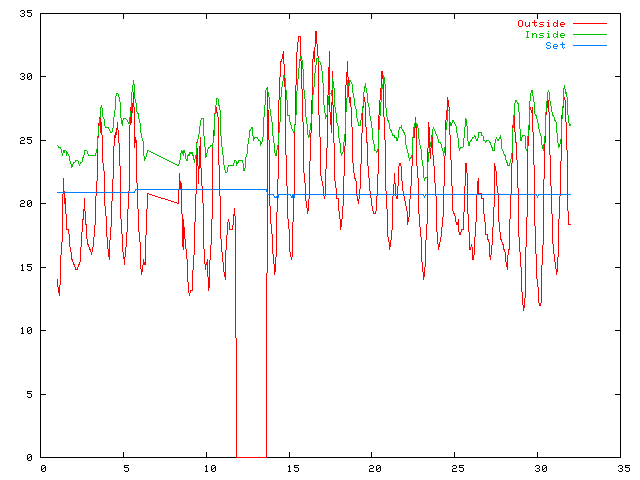
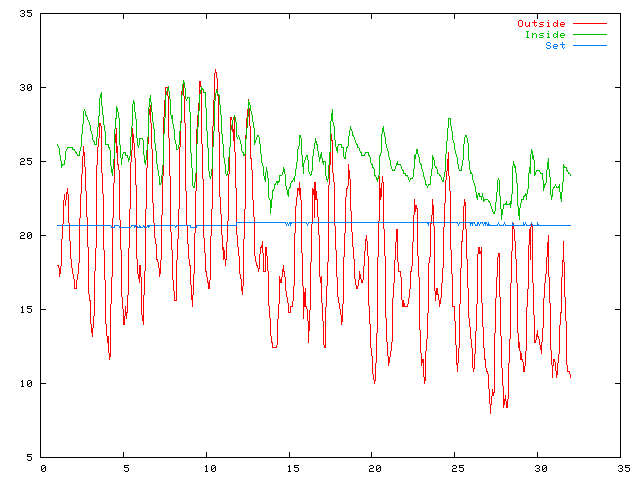
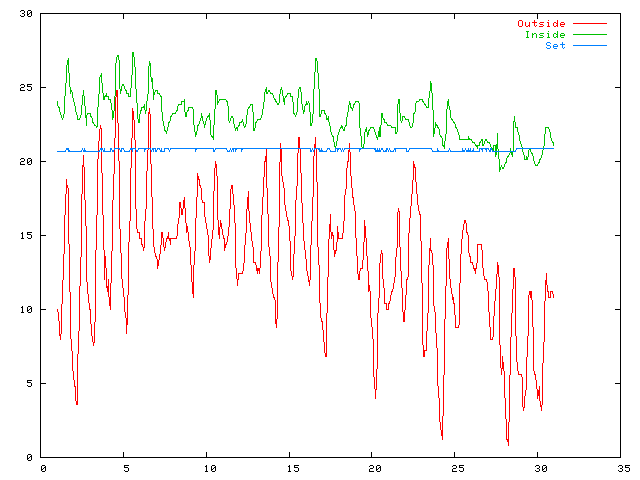
On all these plots, the Y axis is temperature in degrees C and the X axis is the day of the month.
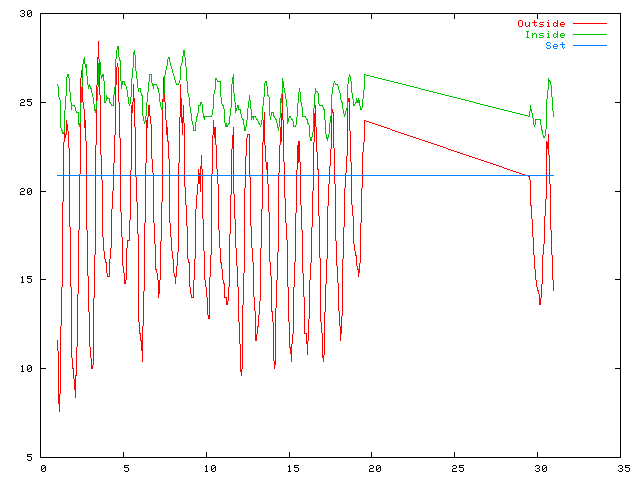
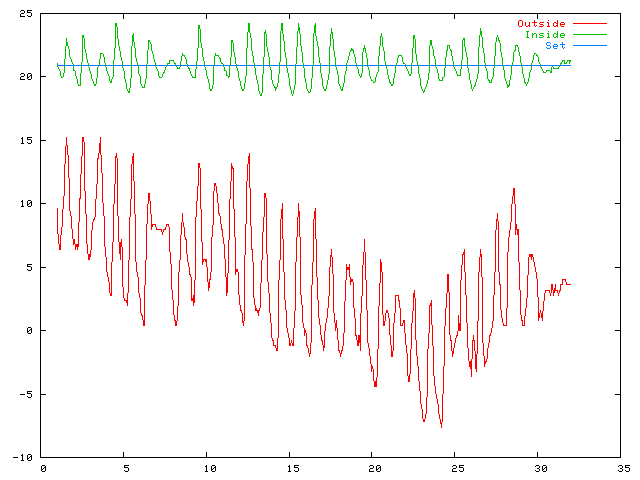
Temperature plot for February 2003
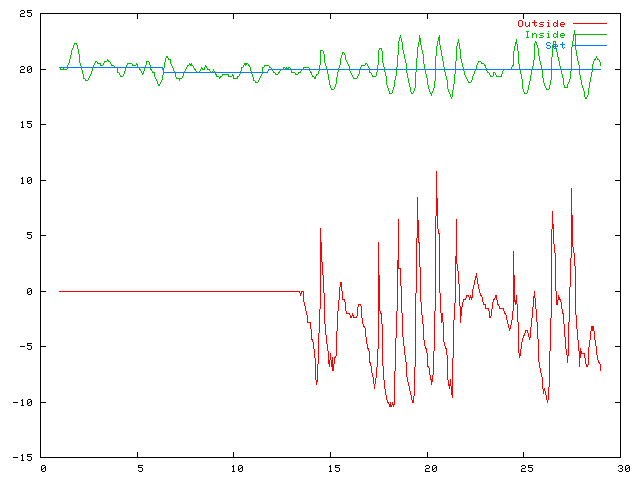
From 13 February 2003 onwards, the measurements have also included the outside temperature.
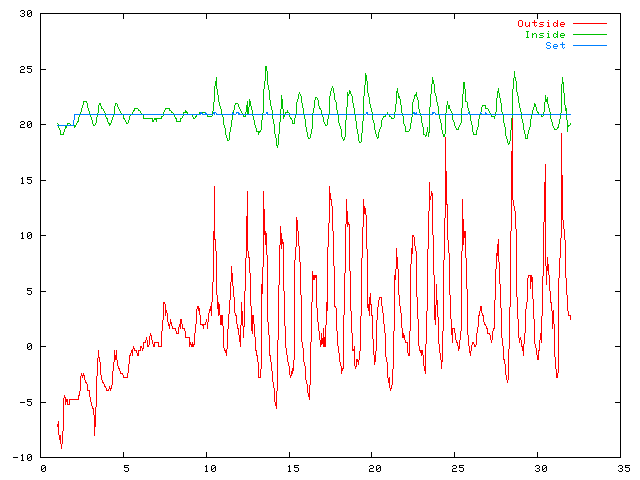
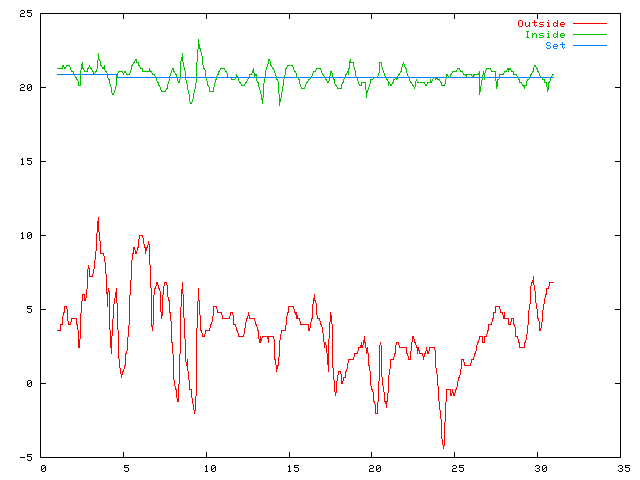
Temperature plot for March 2003
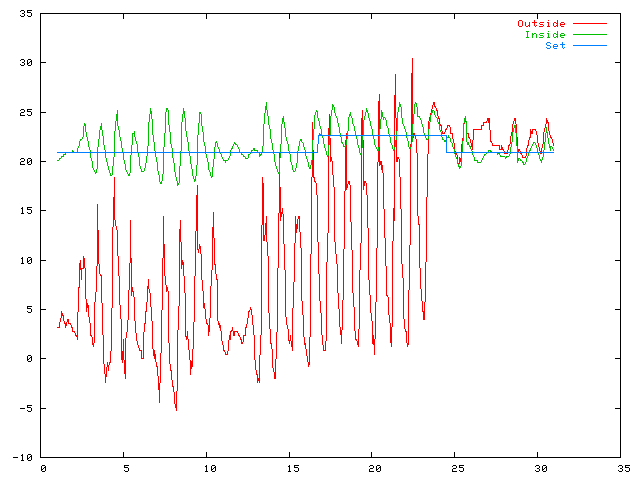
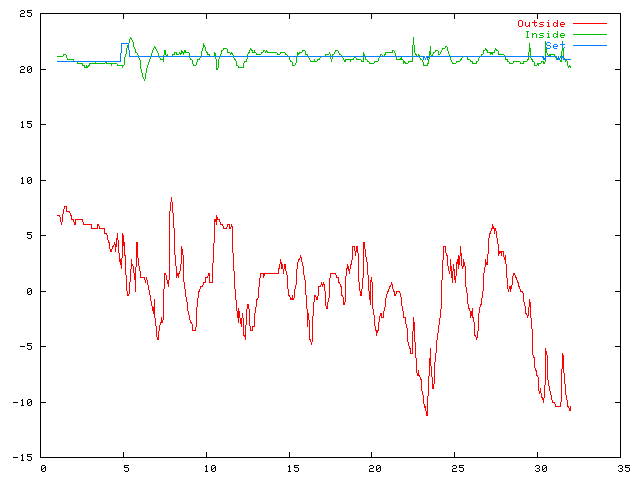
Temperature plot for April 2003
The large daily variations in outside temperature is probably from the sun being up. It might have been heating up the wall where the sensor sits, as well as the house, since the inside temperature is also varying a lot more on the same days. Putting up sensors for sunlight and perhaps moving the thermometer sensor to the north side of the house might help explaining this phenomenon.
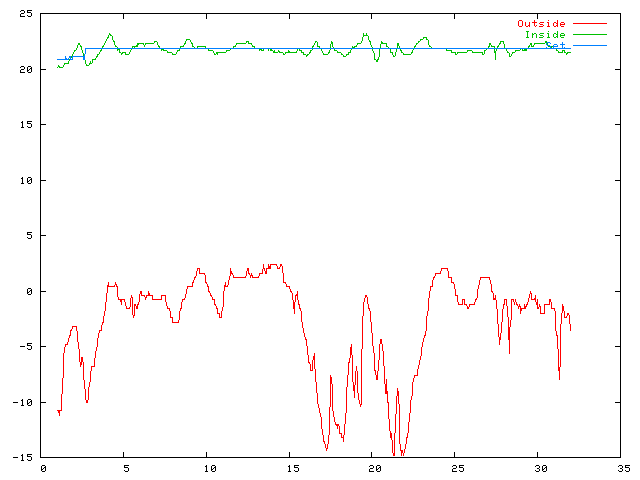
For a while, from April 24 to May 24, the external sensor was taken indoors for some testing, so during this period, so inside and outside temperature will read about the same.
The heating was turned off at the beginning of this period. From now on until October, the inside temperature is no longer attempted kept near the set temperature.
Temperature plot for May 2003
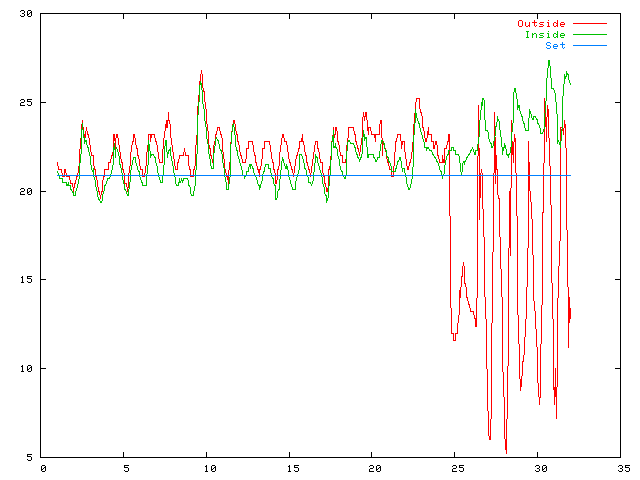
The middle of May was nice and warm. Then suddenly one night, 27-28, it was really cold.
Temperature plot for June 2003
There was a power loss during the late part of June, from the 19th to the 29th.
Temperature plot for July 2003
There was an outage of data-logging on July 6-8. The outside sensor was out of service from the July 11 to 13.
Maximum temperature recorded outside was on July 16, at 15.14 UTC, 33.6 degrees.
Temperature plot for August 2003
Temperature plot for September 2003
Temperature plot for October 2003
The heating was turned on again at the beginning of October.
Temperature plot for November 2003
The system was down for a major modification on November 13.
Temperature plot for December 2003
The lowest temperature recorded in 2003 was on in the morning of December 23, at 07.07 UTC, -11.2 degrees.
Temperature plot for January 2004
Temperature Plots
| 2001-2002 | 2003 | 2004 | 2005 | 2006 | 2007 | 2008 | 2009 | ||
| 2010 | 2011 | 2012 | 2013 | 2014 | 2015 | 2016 | 2017 | 2018 | 2019 |
| 2020 | 2021 | 2022 | 2023 | 2024 | 2025 | 2026 |
Air Pressure Plots
| 2013 | 2014 | 2015 | 2016 | 2017 | 2018 | 2019 |
| 2020 | 2021 | 2022 | 2023 | 2024 | 2025 | 2026 |
Rainfall Plots
| 2007 | 2008 | 2009 | |||||||
| 2010 | 2011 | 2012 | 2013 | 2014 | 2015 | 2016 | 2017 | 2018 | 2019 |
| 2020 | 2021 | 2022 | 2023 | 2024 | 2025 | 2026 |