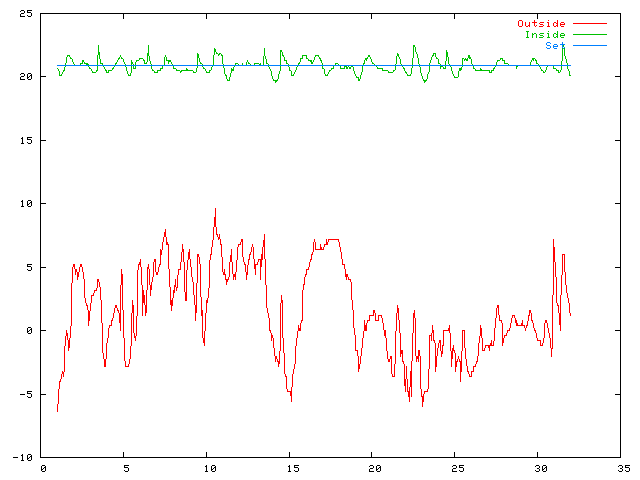
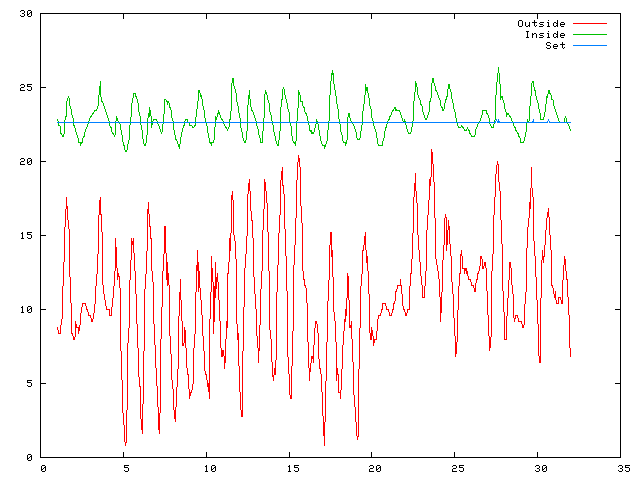
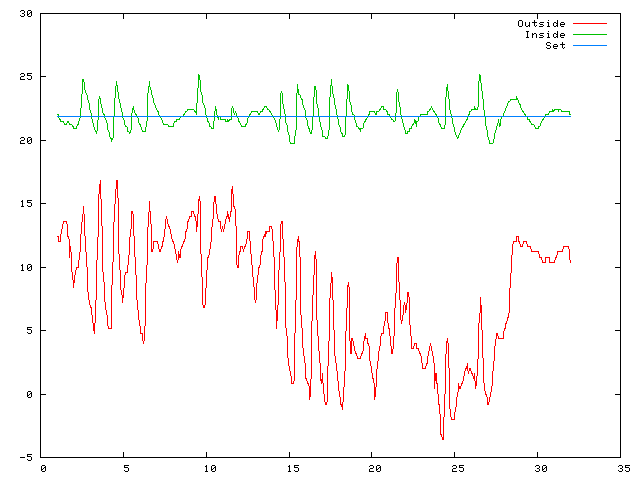
On all these plots, the Y axis is temperature in degrees C and the X axis is the day of the month. There are placeholders for the later months, data will be made available as time goes on.
Temperature plot for January 2005
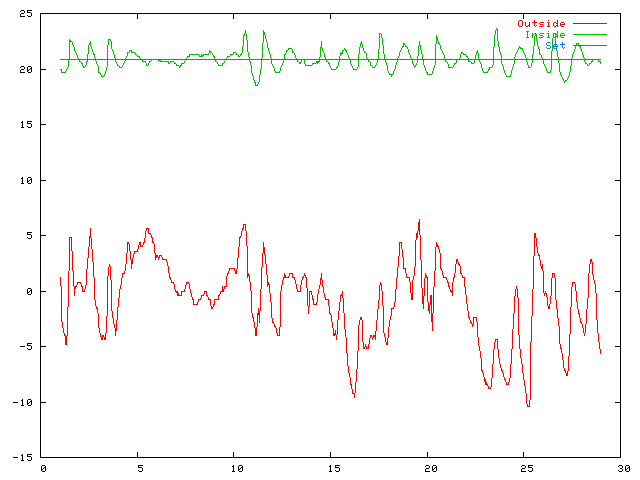
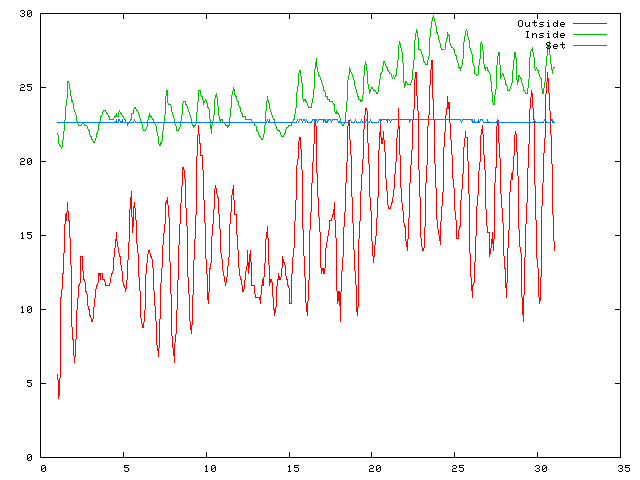
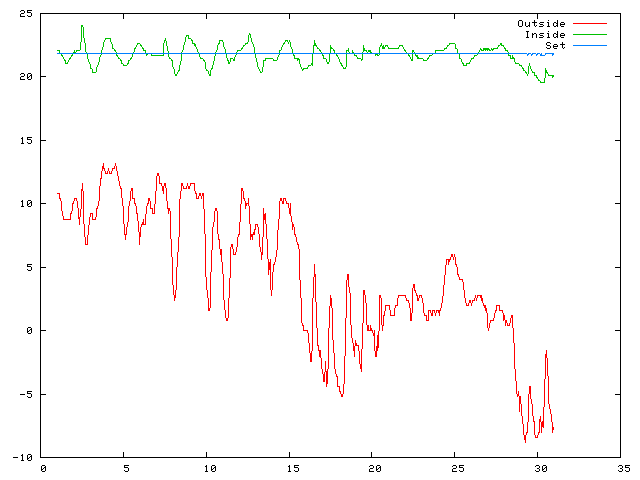
Temperature plot for February 2005
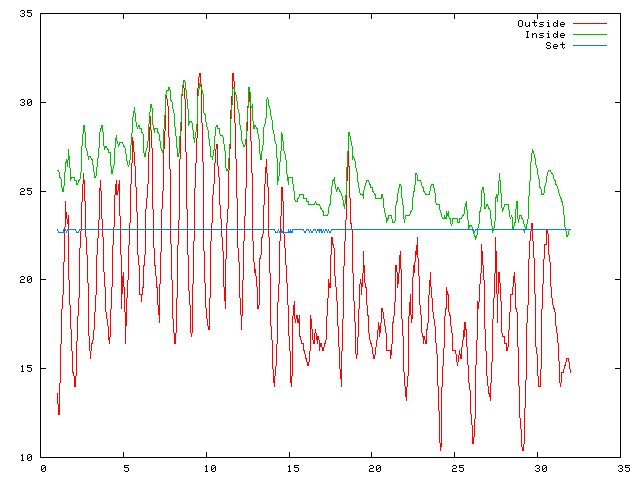
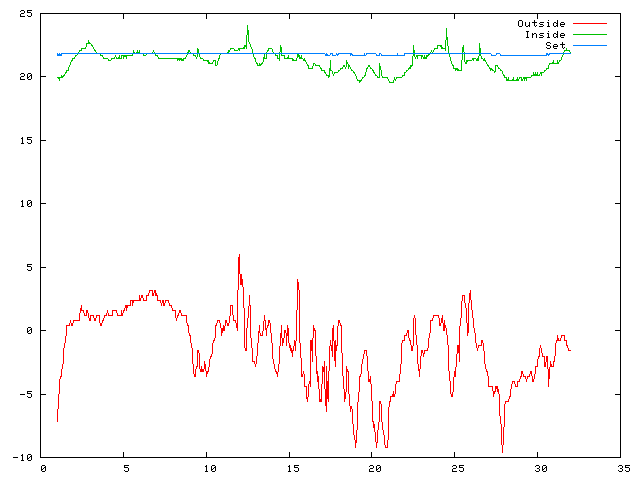
Temperature plot for March 2005
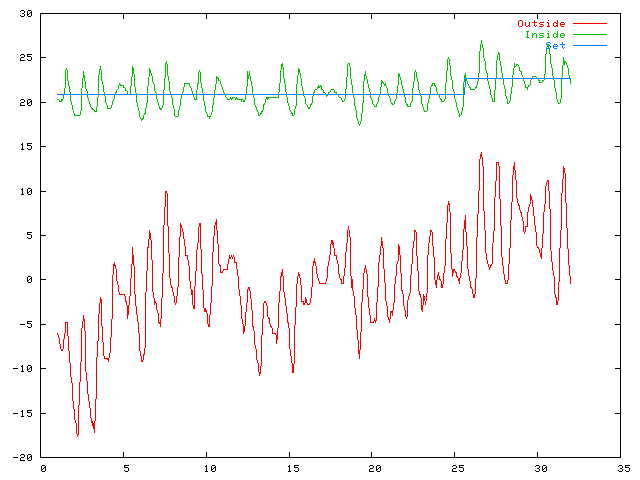
Minimum this winter is -17.6 at March 2 at 05.45. We may also note that the inside temperature variations have been bigger recently. In fact, this may point towards an improvement in the algorithm, to allow the outside temperature to play a part in the motor setting.
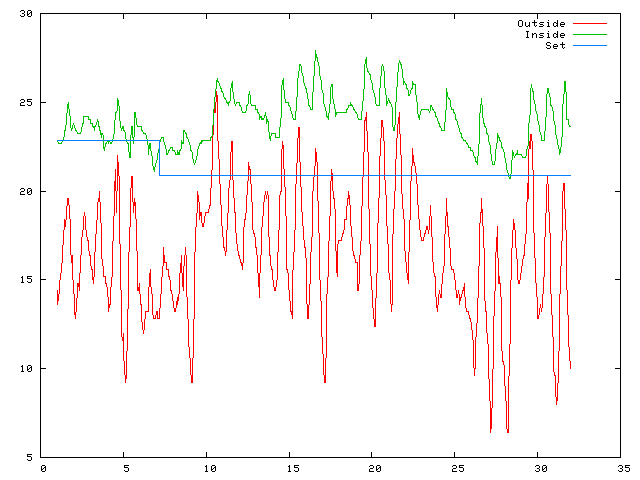
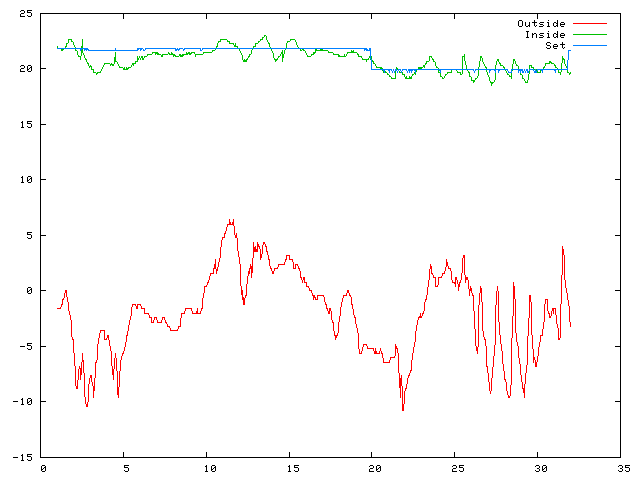
Temperature plot for April 2005
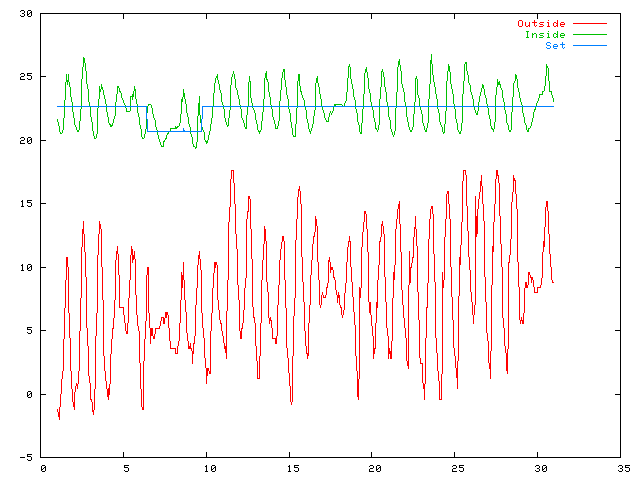
Spring is arriving
Temperature plot for May 2005
Temperature plot for June 2005
Temperature plot for July 2005
Temperature plot for August 2005
Temperature plot for September 2005

Temperature plot for October 2005
Temperature plot for November 2005
Temperature plot for December 2005
Temperature plot for January 2006
Temperature Plots
| 2001-2002 | 2003 | 2004 | 2005 | 2006 | 2007 | 2008 | 2009 | ||
| 2010 | 2011 | 2012 | 2013 | 2014 | 2015 | 2016 | 2017 | 2018 | 2019 |
| 2020 | 2021 | 2022 | 2023 | 2024 | 2025 | 2026 |
Air Pressure Plots
| 2013 | 2014 | 2015 | 2016 | 2017 | 2018 | 2019 |
| 2020 | 2021 | 2022 | 2023 | 2024 | 2025 | 2026 |
Rainfall Plots
| 2007 | 2008 | 2009 | |||||||
| 2010 | 2011 | 2012 | 2013 | 2014 | 2015 | 2016 | 2017 | 2018 | 2019 |
| 2020 | 2021 | 2022 | 2023 | 2024 | 2025 | 2026 |