On all these plots, the Y axis is temperature in degrees C and the X axis is the day of the month.
The system was set up during the spring of 2001, and there were some measurements done in April to check operation. At this early time, only the inside set and measured temperatures were recorded, and the hour count from start. Only in the fall of 2002 did the system record the time of day in the data sets themselves. However, this can be reconstructed for these old measurements. Some of them, starting with the heating season on the evening of the 30th September 2001, and included on the plot for October 2001 here.
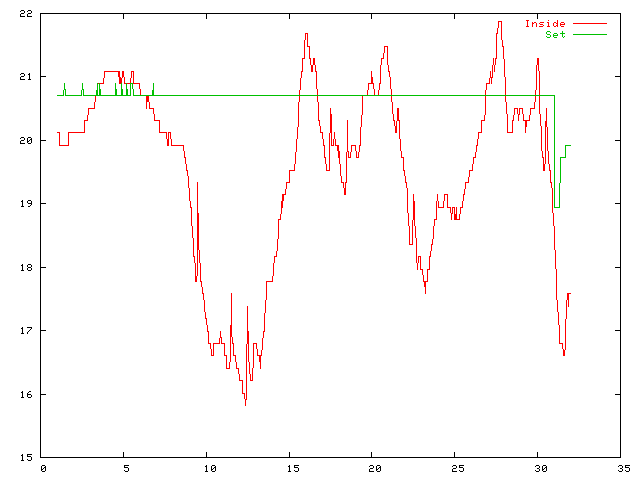
Temperature plot for October 2001
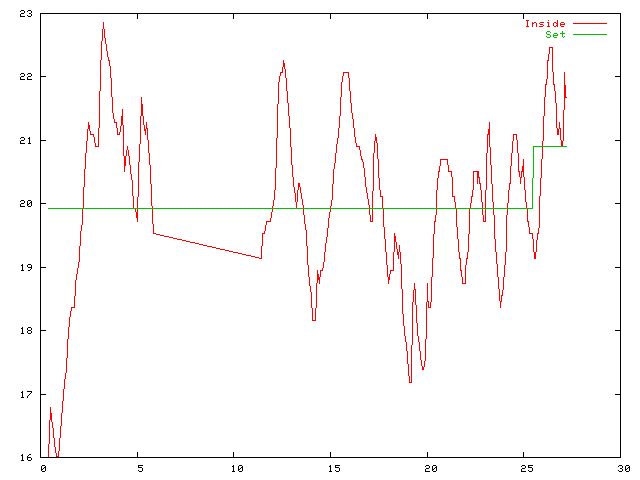
No measurements were done from the 5th to the 11th. There are also a few data points from the afternoon of September 30th. It was a cold afternoon with only about 16 degrees inside... No outside temperature was measured at this early time.
For the first period, measurements were tried in various periods from 10 minutes to 2 hours. The software in the controller in the boiler room has such settings stored in an EEPROM, so it was easy to tune the system. Eventually, a period of one hour was found to be about right.
The system was off during the summer of 2002 and was turned on in late September that year.
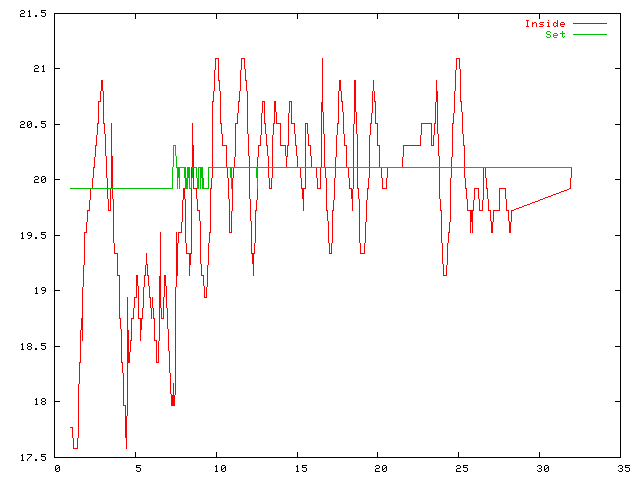
Temperature plot for September 2002
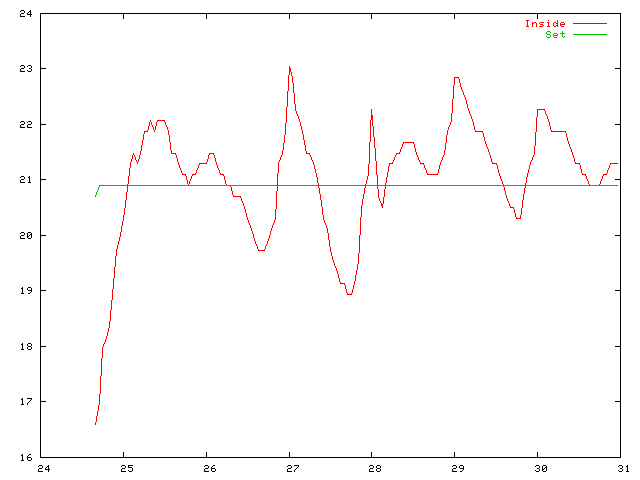
Like last year, the heating was turned on when it got unpleasantly cold inside... We may also note that the heating season was started about one week earlier than in 2001.
Temperature plot for October 2002
There was an outage around the 21st.
Temperature plot for November 2002
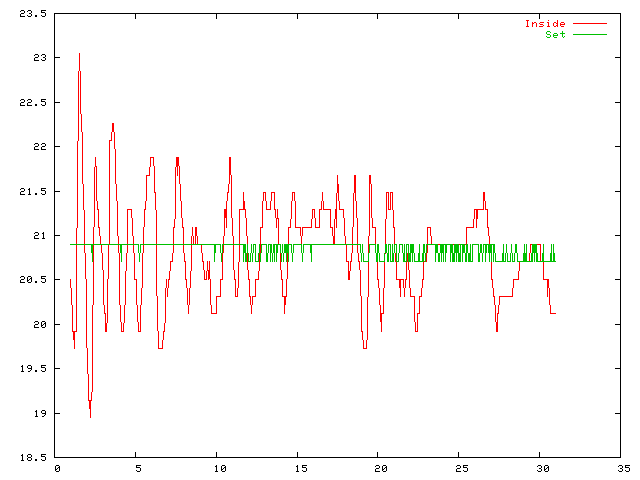
Temperature plot for December 2002
I'm not sure why the heating seems to have been off from the 8th to the 15th and then again during Christmas. I might have been out travelling around that time, and the water system might have run low from some leaks known around that time, when the expansion vessel was removed.
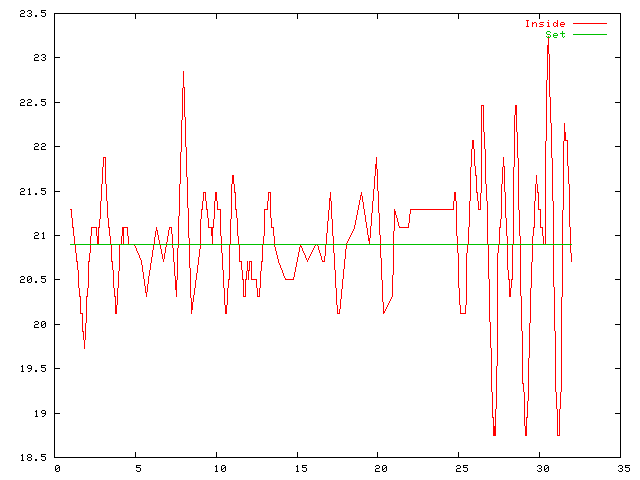
Temperature plot for January 2003
The scale turned out quite exaggerated here. You'd think there was a cold spell in early January, but it was only down to about 18.5-19 degrees, and not really cold. Not like the 16 degrees in December. It could be because of the same kind of water loss.
From February 2003 onwards, the measurements have also included the outside temperature.
Temperature Plots
| 2001-2002 | 2003 | 2004 | 2005 | 2006 | 2007 | 2008 | 2009 | ||
| 2010 | 2011 | 2012 | 2013 | 2014 | 2015 | 2016 | 2017 | 2018 | 2019 |
| 2020 | 2021 | 2022 | 2023 | 2024 | 2025 | 2026 |
Air Pressure Plots
| 2013 | 2014 | 2015 | 2016 | 2017 | 2018 | 2019 |
| 2020 | 2021 | 2022 | 2023 | 2024 | 2025 | 2026 |
Rainfall Plots
| 2007 | 2008 | 2009 | |||||||
| 2010 | 2011 | 2012 | 2013 | 2014 | 2015 | 2016 | 2017 | 2018 | 2019 |
| 2020 | 2021 | 2022 | 2023 | 2024 | 2025 | 2026 |