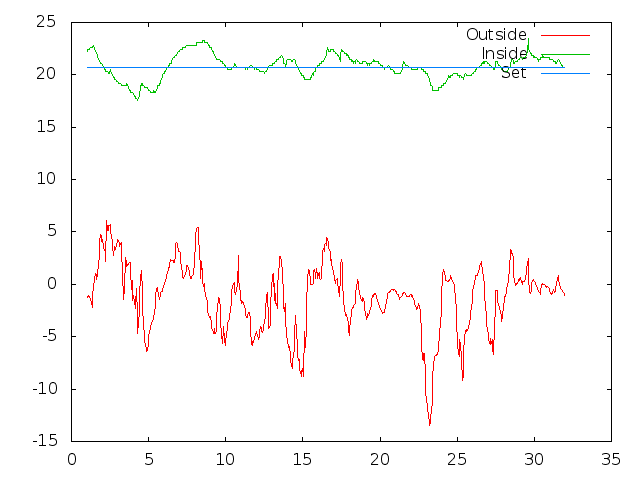
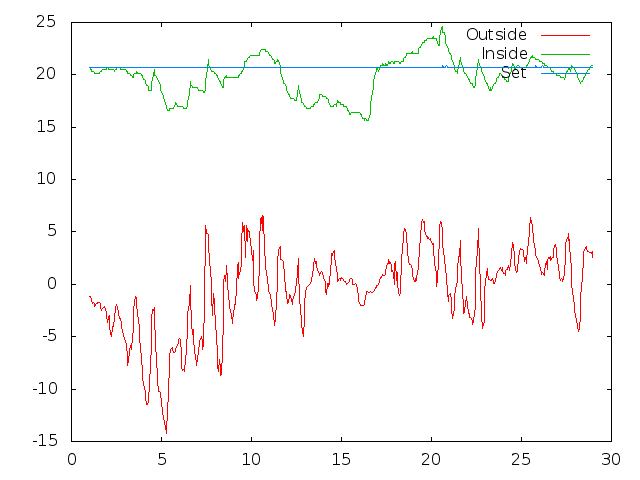
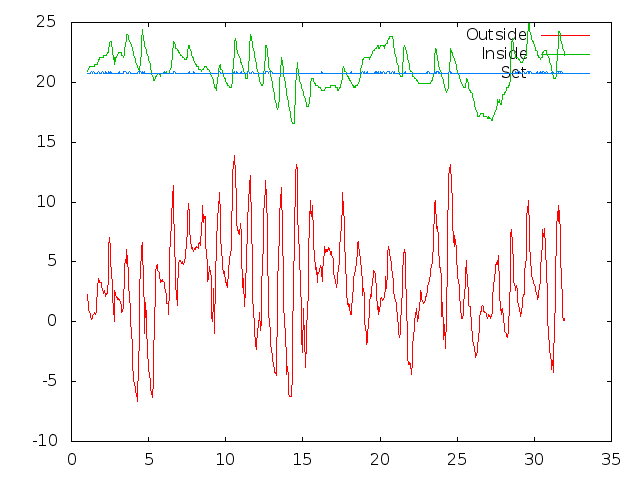
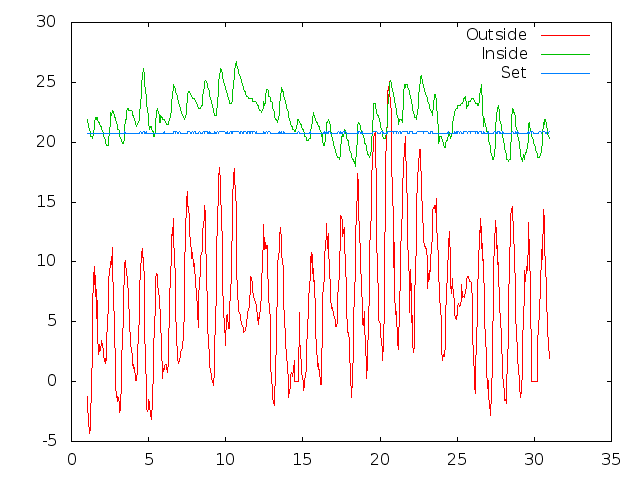
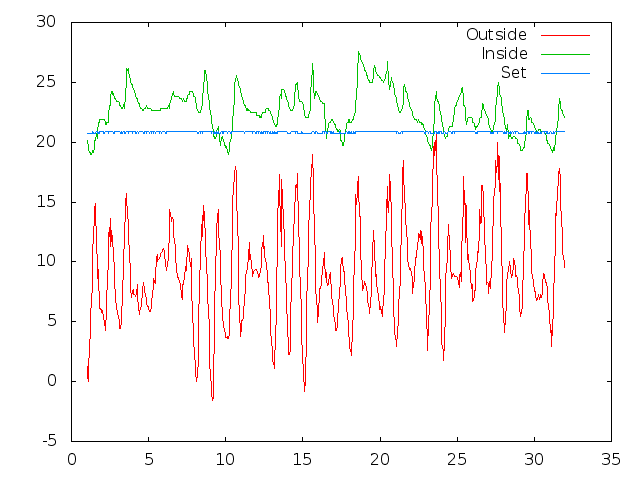
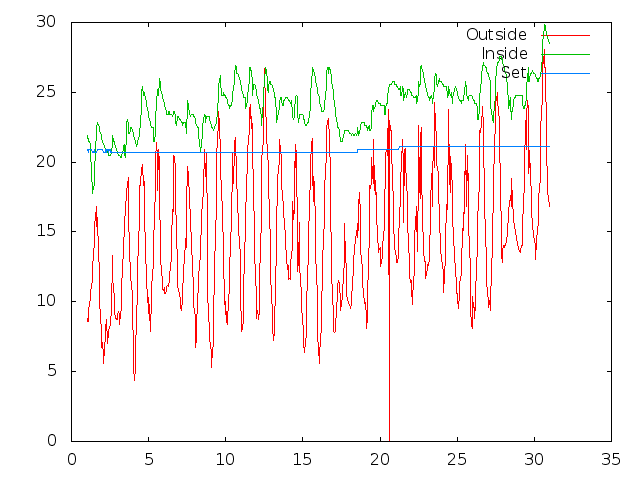
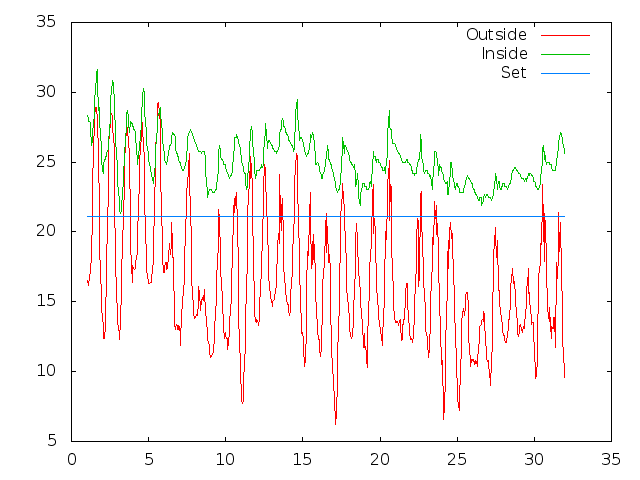
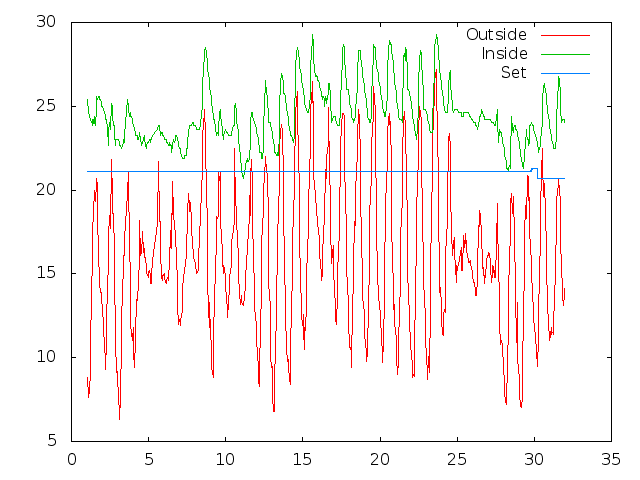
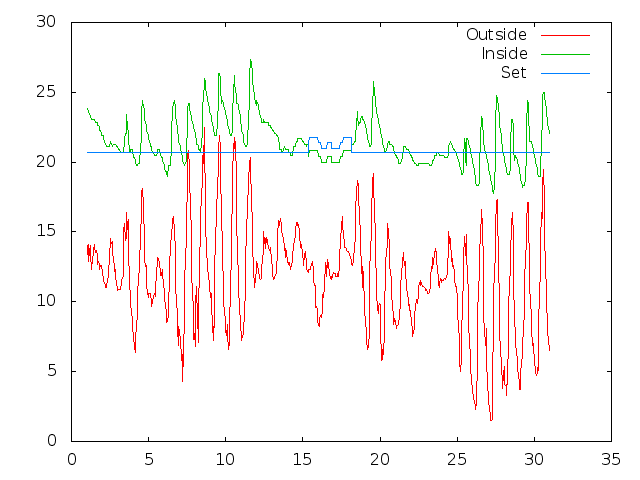
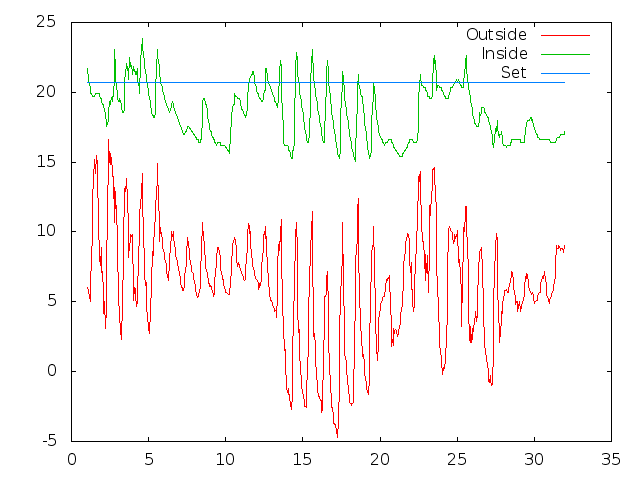
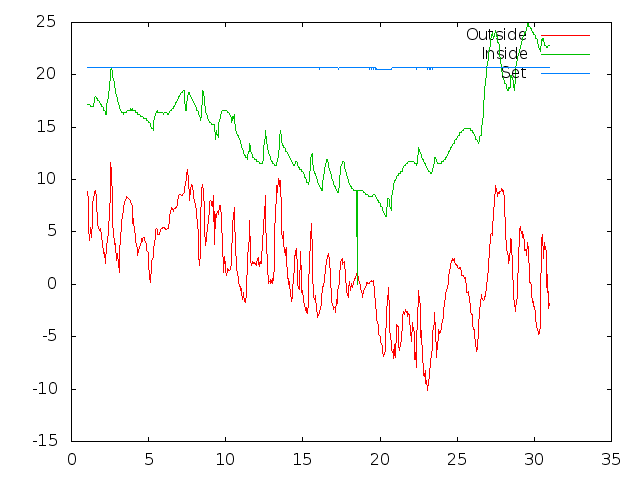
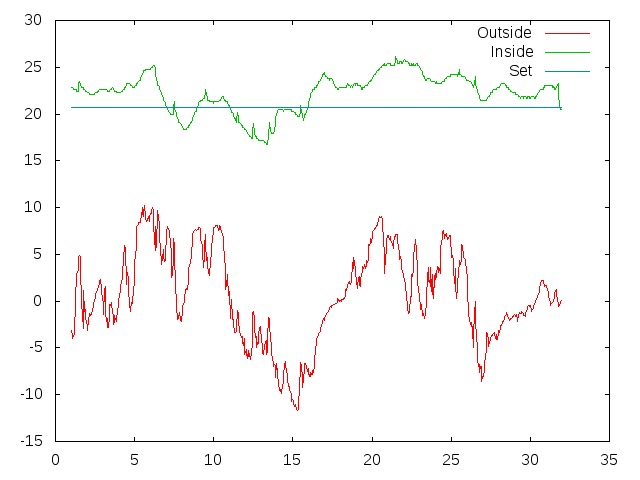
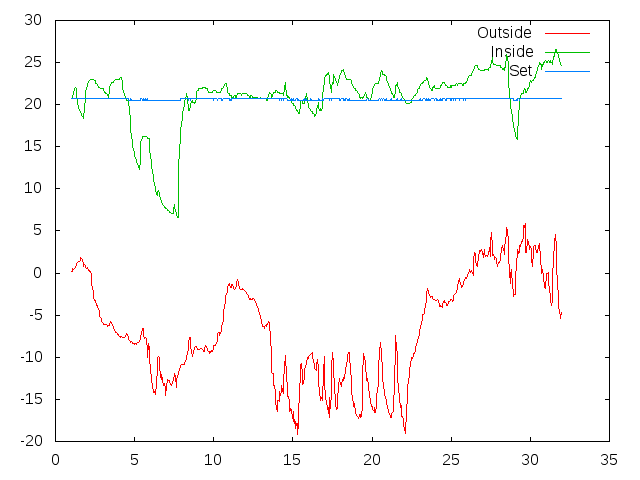
On all these plots, the Y axis is temperature in degrees C and the X axis is the day of the month. There are placeholders for the later months, data will become available as time goes on.
Temperature plot for January 2015
Temperature plot for February 2015
Temperature plot for March 2015
Temperature plot for April 2015
Temperature plot for May 2015
Temperature plot for June 2015
Temperature plot for July 2015
On 2015-08-01 the tower was changed over from the previous "stn50" one to the "disk7/stn71". Temperature sensor changed from a MCP9801 to BMP180 combined with pressure. Light sensor is now both a photocell with qualitative voltage output, and an s9705 which saturates at around 1100 lux.
Temperature plot for August 2015
Temperature plot for September 2015
Temperature plot for October 2015
Temperature plot for November 2015
Temperature plot for December 2015
Temperature plot for January 2016
Temperature Plots
| 2001-2002 | 2003 | 2004 | 2005 | 2006 | 2007 | 2008 | 2009 | ||
| 2010 | 2011 | 2012 | 2013 | 2014 | 2015 | 2016 | 2017 | 2018 | 2019 |
| 2020 | 2021 | 2022 | 2023 | 2024 | 2025 | 2026 |
Air Pressure Plots
| 2013 | 2014 | 2015 | 2016 | 2017 | 2018 | 2019 |
| 2020 | 2021 | 2022 | 2023 | 2024 | 2025 | 2026 |
Rainfall Plots
| 2007 | 2008 | 2009 | |||||||
| 2010 | 2011 | 2012 | 2013 | 2014 | 2015 | 2016 | 2017 | 2018 | 2019 |
| 2020 | 2021 | 2022 | 2023 | 2024 | 2025 | 2026 |